Statistics
- Free Plan
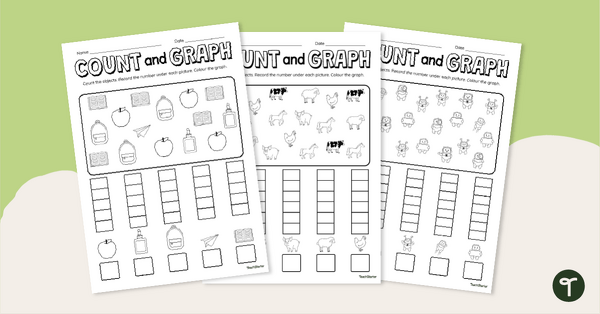
Count and Graph Worksheet Pack
Explore counting and graphing skills with this set of three worksheets.
- Plus Plan
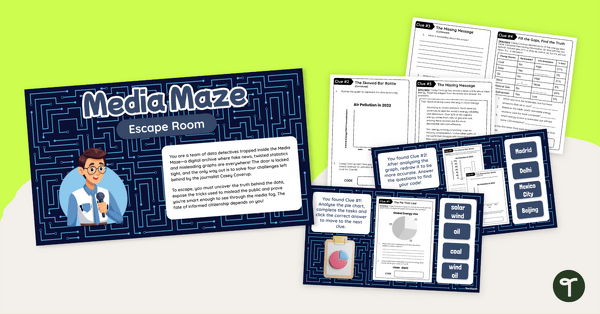
Interpreting Data Year 6 Escape Room
Play our interpreting data year 6 escape room to give your students engaging practise identifying and correcting misleading data displays.
- Free Plan
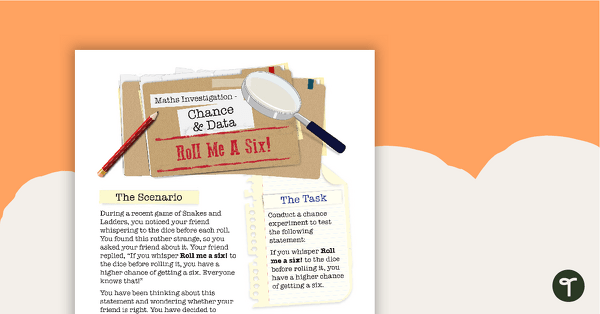
Chance and Data Maths Investigation - Roll Me a Six!
A mathematics investigation involving chance and data, embedded in a real-world context.
- Plus Plan
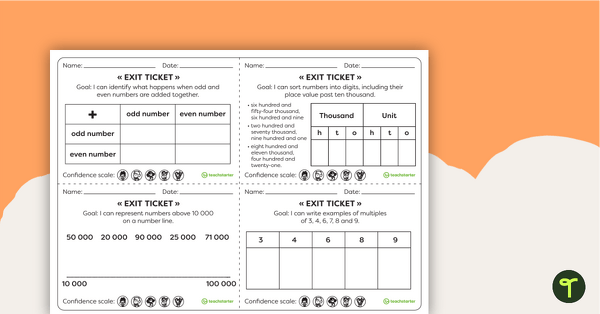
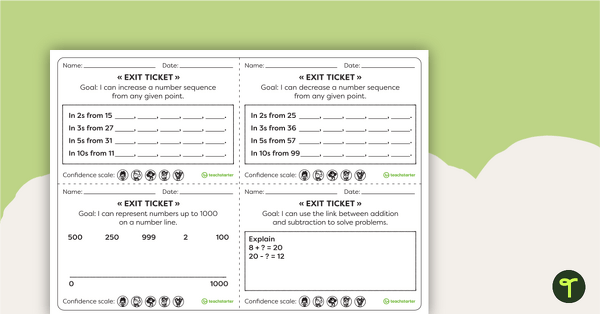
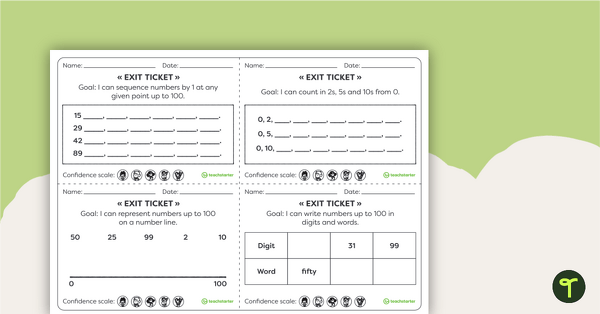
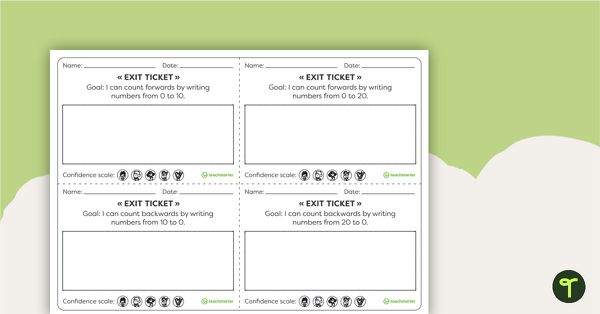
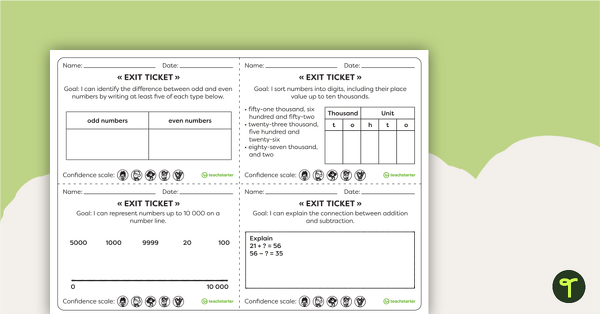
Year 4 Numeracy Exit Tickets – Worksheets
24 Numeracy Exit Ticket activities for students to provide evidence of their learning progress.
- Plus Plan

Maths Warm Ups Interactive PowerPoint - Year 2
A PowerPoint providing a series of warm up activities for Year 2 students across the curriculum.
- Plus Plan
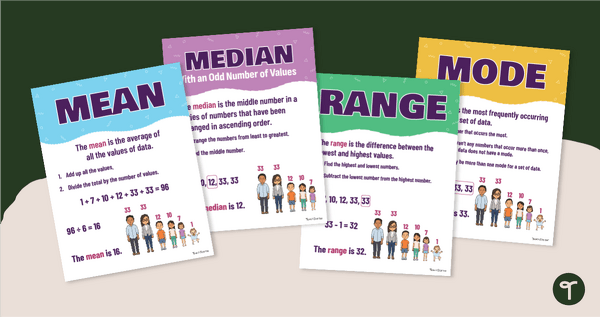
Mean, Median, Mode & Range Poster Pack
Download a Mean, Median, Mode & Range poster pack to help your students remember measures of central tendency.
- Plus Plan
Year 2 Numeracy Exit Tickets – Worksheets
35 Numeracy Exit Ticket activities for students to provide evidence of their learning progress.
- Plus Plan
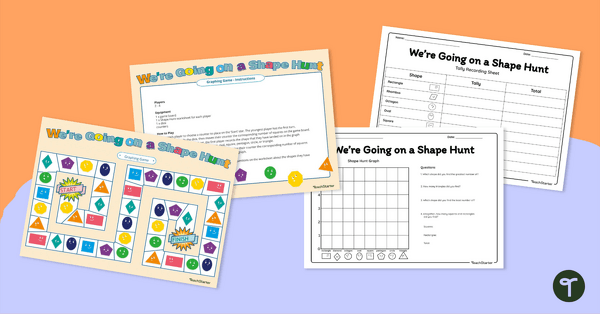
We're Going On a Shape Hunt! Graphing Game
Consolidate students' knowledge of 2D shapes while teaching about data collection, recording and graphing!
- Plus Plan
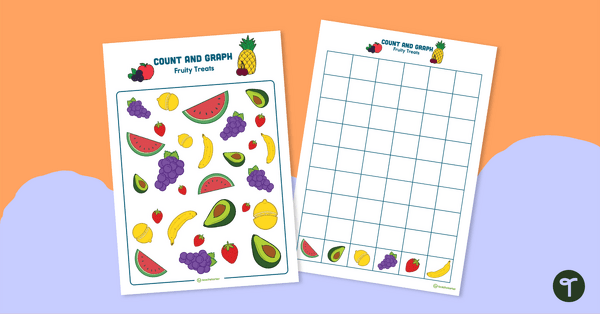
Count and Graph – Fruity Treats
A fruit-themed hands-on activity to introduce graphing skills.
- Plus Plan
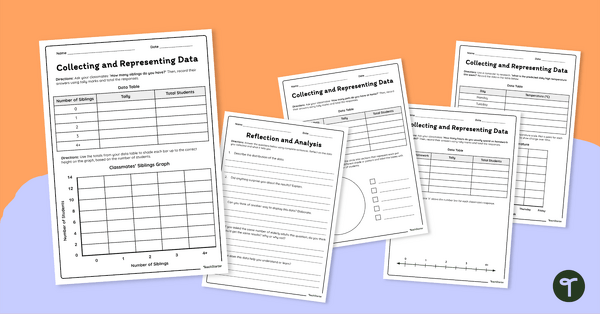
Collecting and Representing Data Worksheet Set
Download our collecting and representing data worksheet set to get your students collecting, organising and displaying data.
- Plus Plan
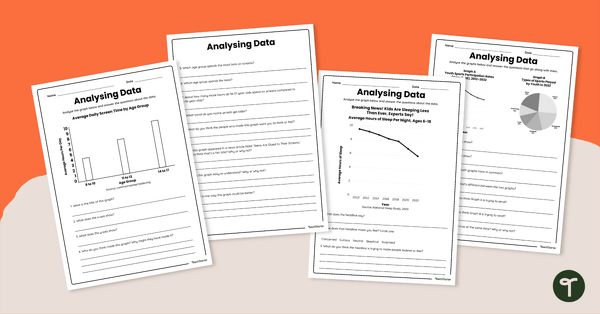
Analysing Data Worksheet Set
Share this analysing data worksheet set with your students to give them varied practice interpreting multiple data representations.
- Plus Plan
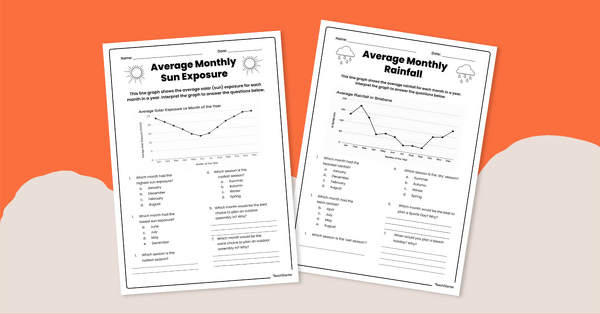
Interpreting Line Graphs Worksheet Pack
Use this set of 4 Grade 5 worksheets to help students practise interpreting real-life data represented as a line graph.
- Plus Plan
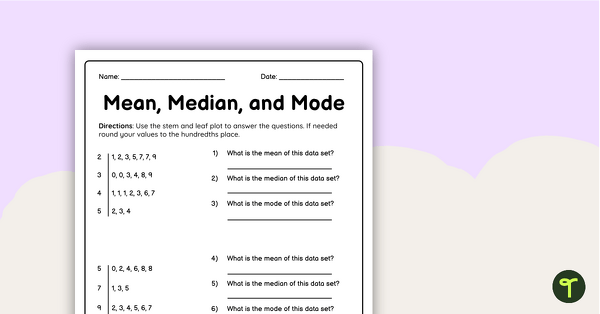
Mean Median Mode Worksheet
Use this double-sided worksheet to check students’ ability to find the mean, median and mode of given data sets.
- Plus Plan
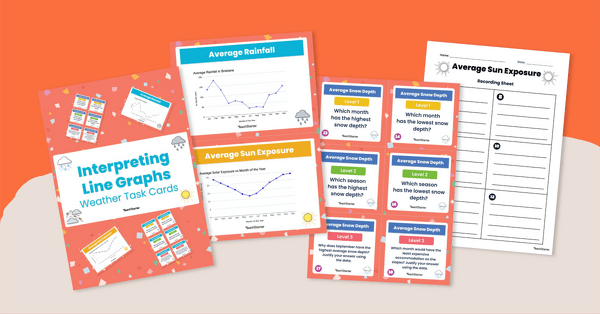
Interpreting Line Graphs Task Cards
Engage your Grade 5 learners with this task card set focused on interpreting line graphs.
- Plus Plan
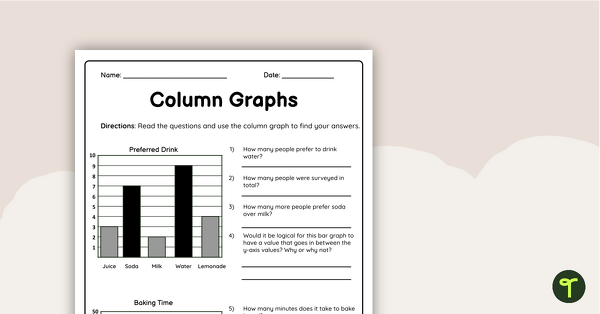
Column Graphs Grade 5 Worksheet
Use this double-sided column graphs worksheet to check your students’ understanding of interpreting and drawing column graphs.
- Plus Plan
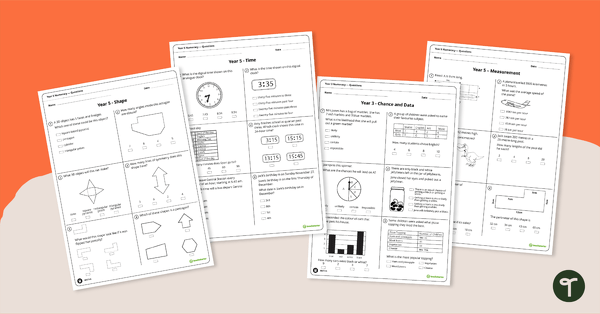
Numeracy Assessment Tool - Year 5
A set of 6 numeracy assessment tools suited to Year 5 students
- Plus Plan
Year 1 Numeracy Exit Tickets – Worksheets
18 Numeracy Exit Ticket activities for students to provide evidence of their learning progress.
- Plus Plan
Foundation Numeracy Exit Tickets – Worksheets
18 Numeracy Exit Ticket activities for students to provide evidence of their learning progress.
- Free Plan
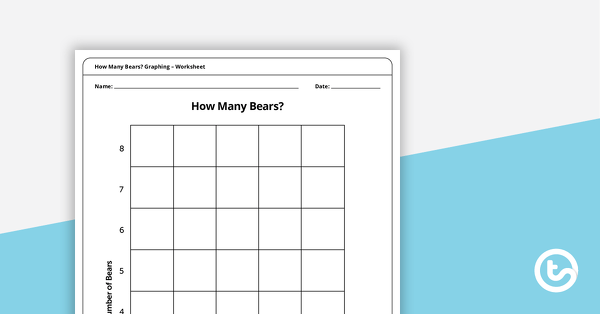
How Many Bears? Graphing – Worksheet
A hands-on picture graph worksheet for students to sort and count coloured bears.
- Plus Plan
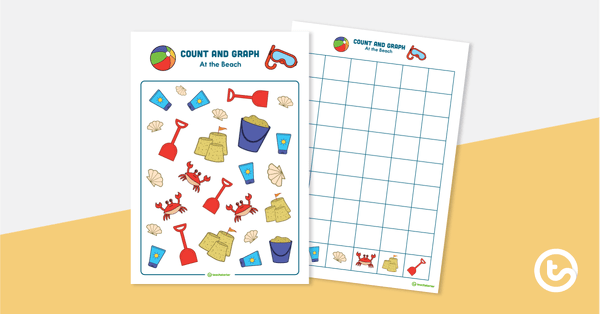
Count and Graph – At the Beach
A beach-themed hands-on activity to introduce graphing skills.
- Free Plan
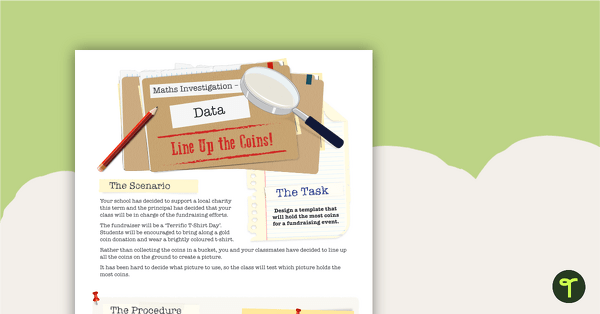
Data Maths Investigation – Line Up the Coins
A mathematics investigation about data, embedded in a real-world context.
- Plus Plan
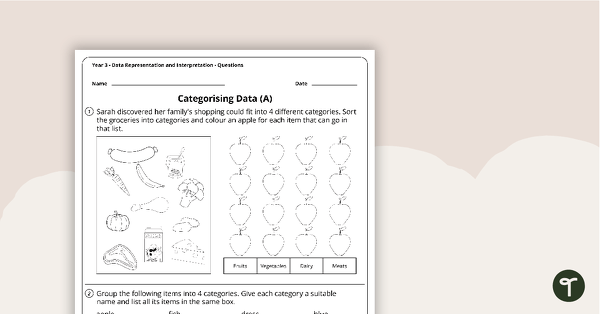
Data Representation and Interpretation Worksheets - Year 3
8 data representation and interpretation worksheets linked to the Australian Curriculum.
- Plus Plan
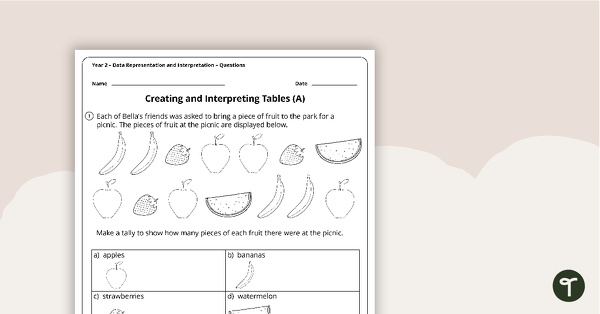
Data Representation and Interpretation Worksheets - Year 2
4 data representation and interpretation worksheets linked to the Australian Curriculum.
- Plus Plan
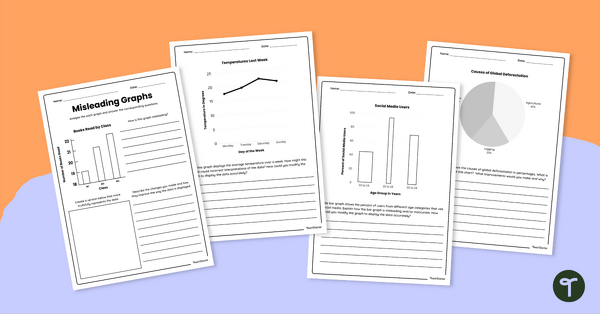
Misleading Graphs Worksheet Set
Download our misleading graphs worksheet set to increase your students’ abilities in statistical literacy and data analysis.
- Plus Plan
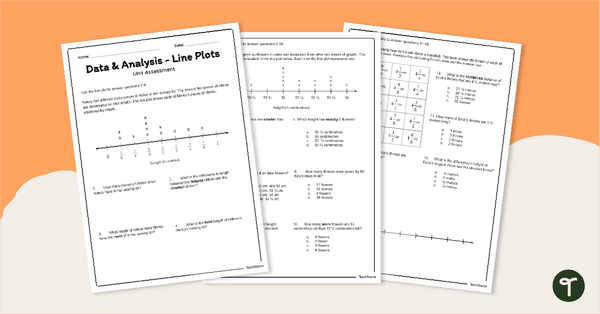
Line Plots / Dot Plots - Year 5 Assessment
Assess student understanding of reading and creating dot plots/line plots with a printable assessment for Year 5.
- Plus Plan
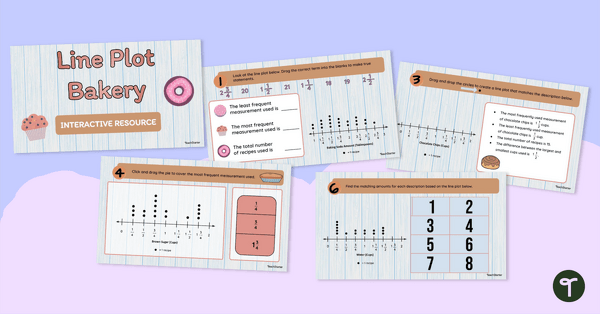
Dot Plot Bakery Interactive Activity
Strengthen dot plot skills with this bakery-themed interactive activity, designed to help students practise creating and analysing dot graphs in a fun, structured way.
- Plus Plan
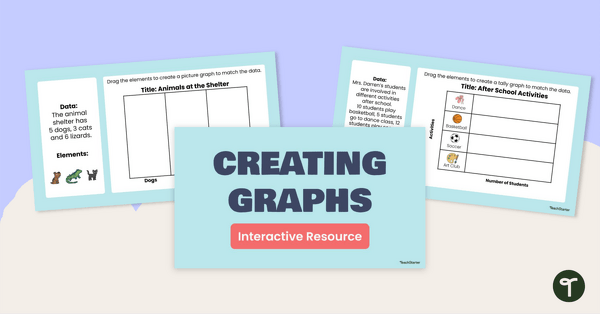
Creating Graphs Interactive Activity
Share this interactive activity with your students to help them practise using digital tools to create graphs from raw data.
- Plus Plan
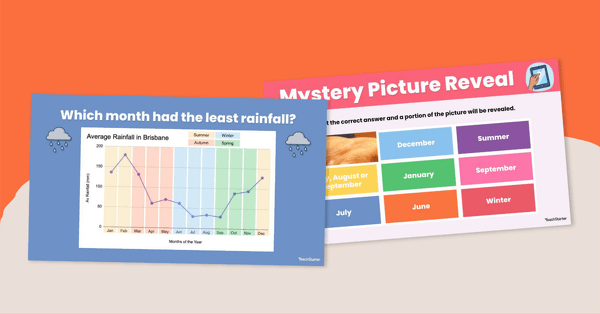
Interpreting Line Graphs Interactive Resource
Use this digital activity to teach students about interpreting real-life data represented as a line graph showing how measurements change over a period of time.
- Plus Plan
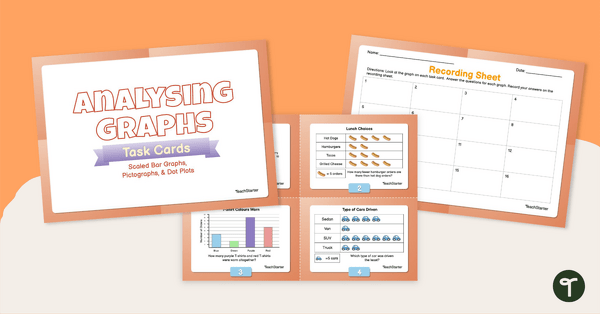
Analysing Graphs — Scaled Bar Graphs, Pictographs, & Dot Plots —Task Cards
Use data analysis skills to analyse scaled bar graphs, pictographs, and dot plots with this set of task cards.
- Plus Plan
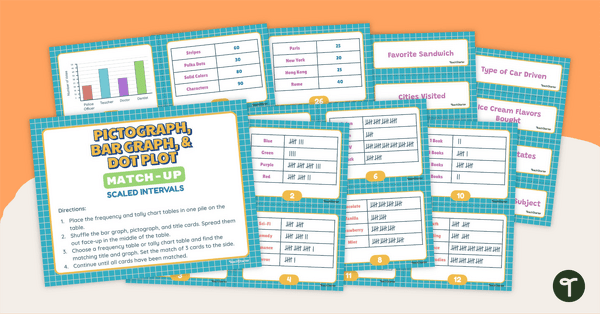
Pictograph, Bar Graph, and Dot Plot Match-Up (Scaled Intervals)
Use data analysis skills to match tally charts and frequency tables with their corresponding bar graph, pictograph, or dot plot.
- Plus Plan
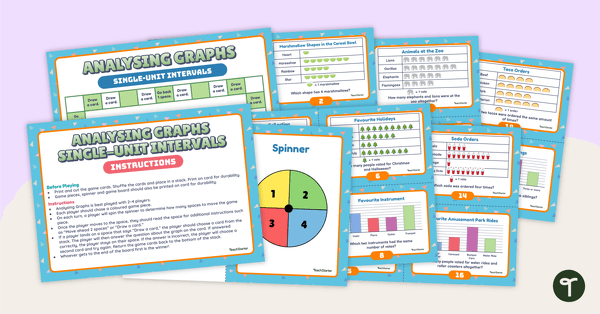
Analysing Graphs (Single-Unit Intervals) Board Game
Sharpen data analysis skills when solving problems with information presented in a single-unit picture or column graph with this board game.
- Plus Plan
Year 3 Numeracy Exit Tickets
21 Numeracy Exit Ticket activities for students to provide evidence of their learning progress.