Statistics and Probability
Statistics and Probability
- Plus Plan
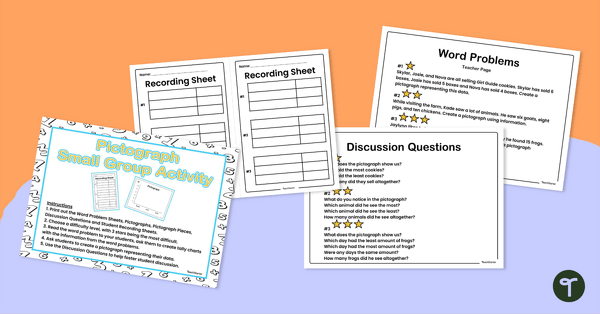
Create a Pictograph - Small Group Activity
Introduce the concept of a pictograph, and teach students how to create simple pictographs based on data from in a word problems.
- Plus Plan
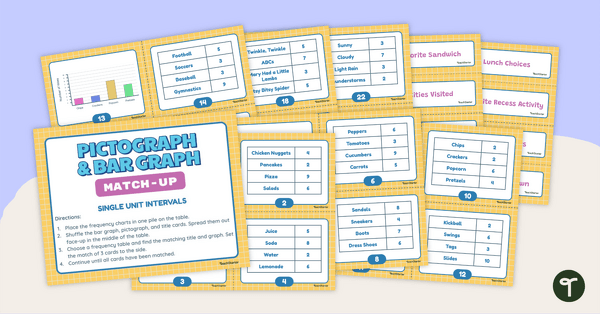
Pictograph and Bar Graph Match-Up (Single-Unit Intervals)
Use data analysis skills to match frequency tables with a corresponding bar graph or pictograph.
- Plus Plan
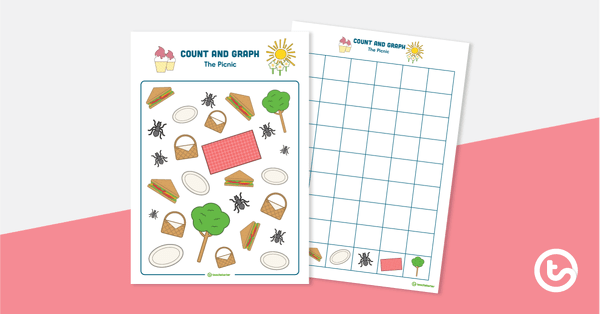
Count and Graph – The Picnic
A picnic-themed hands-on activity to introduce graphing skills.
- Plus Plan
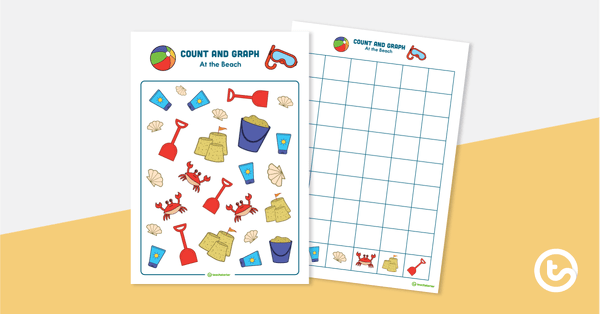
Count and Graph – At the Beach
A beach-themed hands-on activity to introduce graphing skills.
- Free Plan
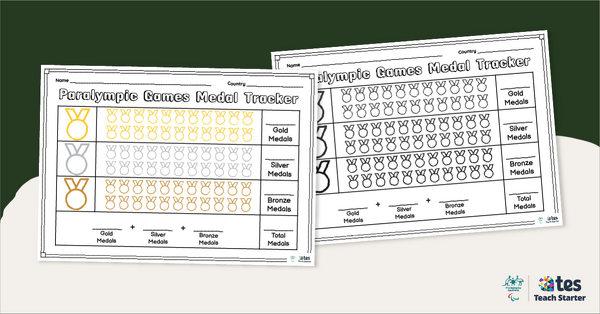
Paralympic Medal Tracking Template
Help your students keep track of the medals won during the Paralympics with our easy-to-use Paralympic medal tracker.
- Plus Plan
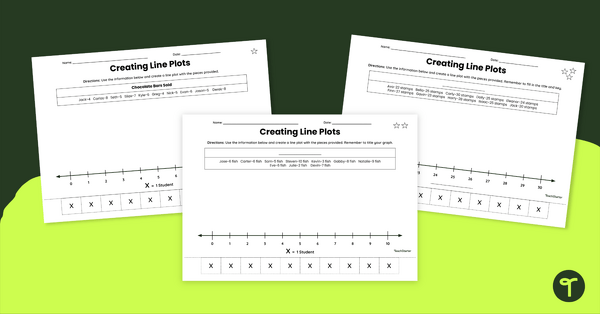
Creating Line Plots Differentiated Cut and Paste Worksheet
Guide students to create line plots with this differentiated cut and paste worksheet.
- Plus Plan
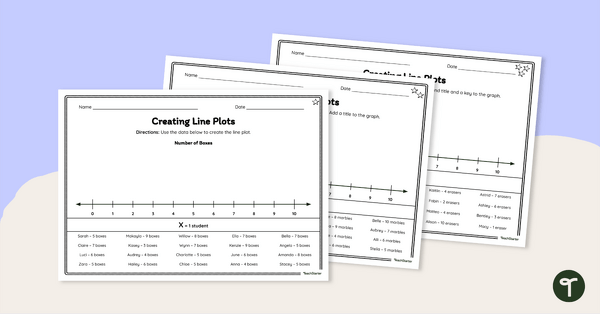
Differentiated Line Plot Worksheet
Guide your students to represent data with this differentiated line plot worksheet.
- Plus Plan
Picture Graph Playoff – Maths Game
A fun picture graph game for students to consolidate gathering and representing data.
- Plus Plan
Count and Graph Templates
A collection of theme-based Count and Graph templates.