Guide students to create line plots with this differentiated cut and paste worksheet.
Let’s Make Line Plots! Maths Worksheets for Years 2 and 3
Your students probably are familiar with different graphs, such as column graphs and pictographs, but how well do they understand line plots? Line plots are another type of visual graph to represent data.
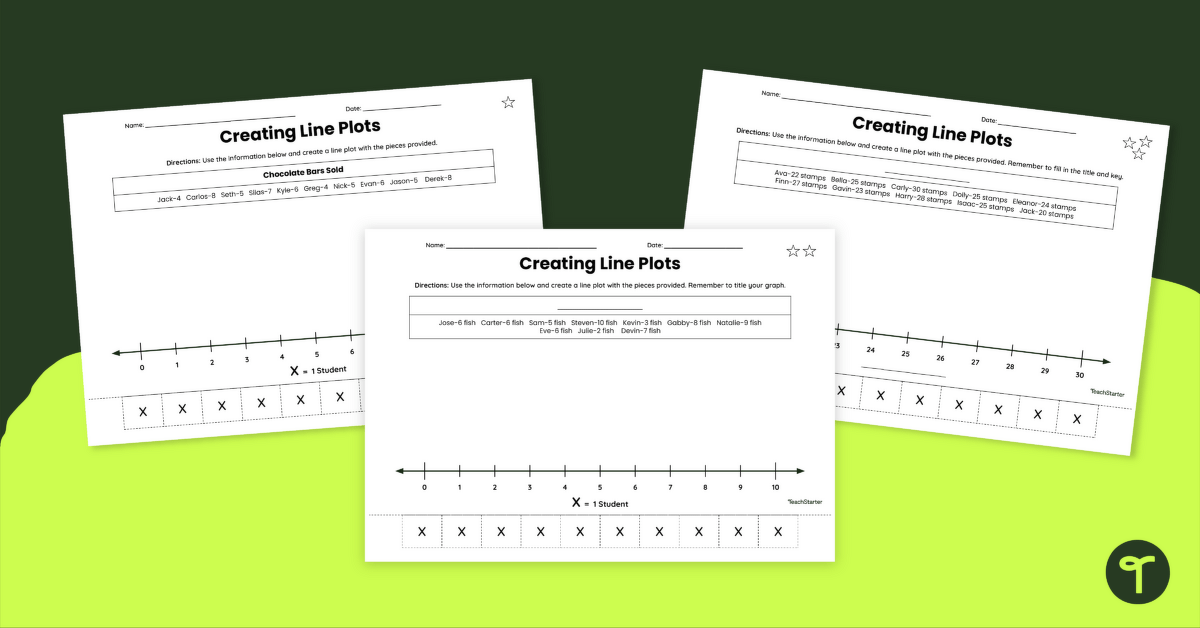
Teach Starter has created a set of differentiated worksheets to help your students strengthen their understanding of line plots. This printable resource includes three levels, each designated with 1, 2 or 3 stars in the upper right-hand corner.
Level 1 – Students will cut and paste the X’s and use the data on the page to create a line plot.
Level 2 – Students will cut and paste the X’s and use the data on the page to create a line plot. Additionally, students must create a title for the graph.
Level 3 – Students will cut and paste the X’s and use the data on the page to create a line plot. Students will also create a title and a key for the line plot.
How to Use Our Differentiated Line Plot Worksheets
Teachers can choose to focus on one type of level or distribute the worksheets according to student ability. This activity can be completed as homework, independent practice or in a guided maths group.
For students that need an added challenge, encourage them to conduct their own surveys and create a line plot to display the data.
How to Get Your Line Plot Worksheets
If you are ready to get your hand on these quick-print maths sheets, simply click on the green download button and choose between the PDF or editable Google Slides file.
If accessing the Google Slides file, you will be prompted first to make a copy to your personal Google Drive.
This resource was created by Brittany Kellogg, a Teach Starter Collaborator.
Looking for More Data Analysis Resources?
Make sure to check out some of our other line plot resources!
[resource:4996448] [resource:4993624] [resource:4992263]

0 Comments
Write a review to help other teachers and parents like yourself. If you'd like to request a change to this resource, or report an error, select the corresponding tab above.