Hang this column / bar graph poster in your classroom to teach your students about the different parts of this commonly used graph.
A Column / Bar Graph Poster in Many Colours
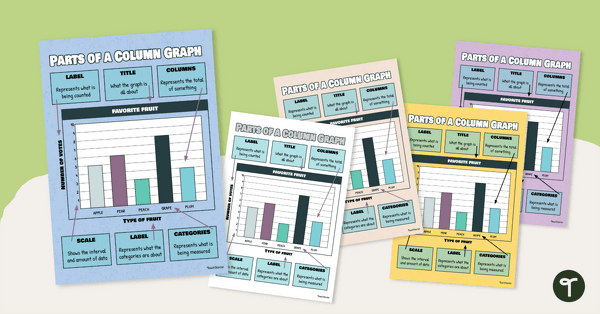
Help your students master the parts of a graph with this vibrant, easy-to-understand column / bar graph poster! Perfect for classroom walls, this resource clearly labels all key parts of a graph, making it an essential reference tool for any maths classroom. Available in five eye-catching colours to match your classroom theme, this digital download is ready to print and use right away.
The features labelled on this bar graph poster include:
- Title
- Label
- Columns / Bars
- Scale
- Categories
This column / bar graph is available as a PDF or an editable Google Slides version, so you can customise the provided graph as you like.
Using Our Column / Bar Graph Anchor Chart
This resource is a one-page poster, but it can be used in many ways! Here are some ideas on using this column/ bar graph anchor chart in the classroom.
Interactive Introduction – Use the poster as a guide while introducing column / bar graphs. Have students identify each part of the graph on your poster before applying it to real-world data.
Graphing Scavenger Hunt – Use the editable features of the Google Slides version to provide students with a graph with blank labels. Then have them label the parts using the terms from the poster. This makes a great review activity!
Partner Check – Encourage peer teaching by having students use the poster as a checklist to evaluate each other’s graphs for accuracy and completeness.
Download This Parts of a Bar Graph Anchor Chart
This parts of a bar graph anchor chart is available in both easy-to-print PDF and Google Slides formats. Click the drop-down arrow located on the download button to choose the option that suits your classroom.
This resource was created by Kaylyn Chupp, a Teach Starter collaborator.
Want More Column Graph for Kids Resources?
If you are looking for more related column graph for kids resources, you’re in the right spot! Take a look at additional offerings below.
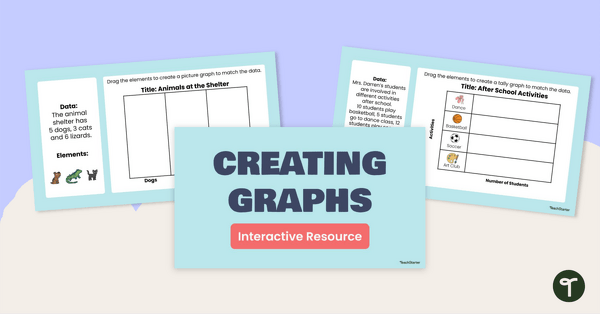
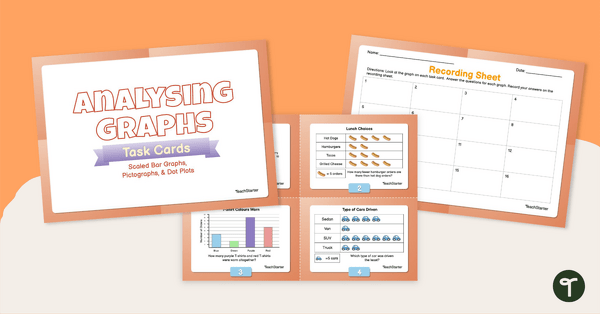
Learn all the features and how to construct a column graph with this 25-page teaching presentation. Share this interactive activity with your students to help them practise using digital tools to create graphs from raw data. Use data analysis skills to analyse scaled bar graphs, pictographs, and dot plots with this set of task cards.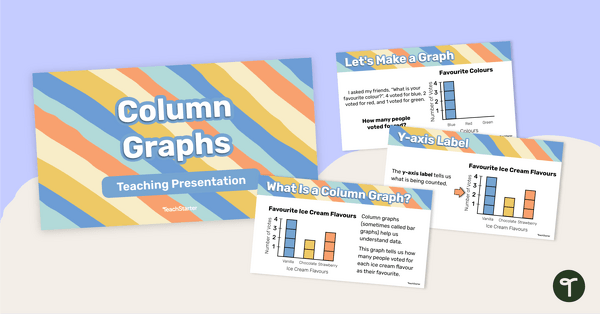
teaching resource
Column Graphs – Teaching Presentation
teaching resource
Creating Graphs Interactive Activity
teaching resource
Analysing Graphs — Scaled Bar Graphs, Pictographs, & Dot Plots —Task Cards


0 Comments
Write a review to help other teachers and parents like yourself. If you'd like to request a change to this resource, or report an error, select the corresponding tab above.