Interpreting Line Graphs in Grade 5
Use this 3-page set of line graph worksheets to enhance students’ proficiency in interpreting line graphs and applying their analytical skills to solve real-world scenarios. This engaging resource aims to empower students with the ability to extract valuable information from line graphs and make informed decisions based on the data presented.
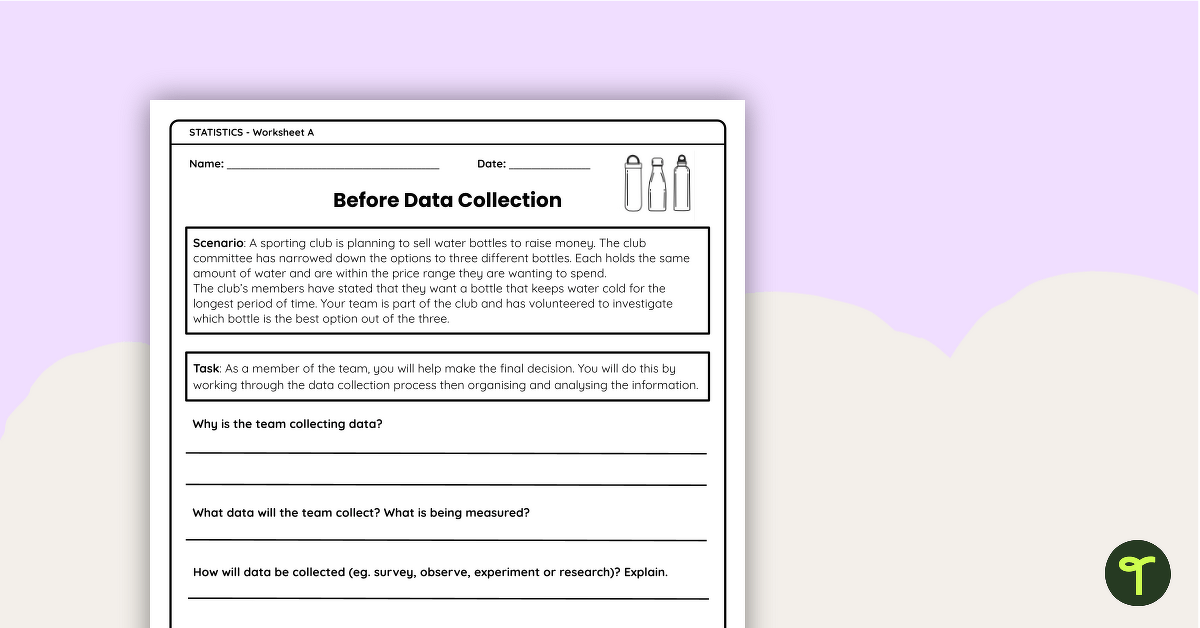
The worksheets focus on the hypothetical (but relatable) scenario of primary school students testing out which drink bottle brand is the most reliable at keeping water cool. In using real-life situations, such as temperature variations, students make connections between data collection, its representation and its analysis and relatable scenarios.
Through completing this worksheet set, your Grade 5 students will demonstrate their ability to interpret line graphs representing change over time, and discuss the relationships that are represented and conclusions that can be made,
An answer key is included with your download to make marking fast and easy!
Tips for Differentiation + Scaffolding
In addition to individual student work time, use this worksheet as a:
- Maths rotation or guided group
- lesson exit ticket
- fast finisher activity
- homework assignment
- whole-class review (via smartboard)
Students who require an additional challenge might include the data from all three water bottles to create one line graph and consider its readability and effectiveness. Students could recreate the investigation in the classroom and collect their own data to analyse and display in a line graph.
Students who need extra support can work in small groups with an adult to discuss the questions and provide scaffolding and guidance
Easily Download & Print
Use the dropdown icon on the Download button to choose between the PDF or Google Slides version of this resource.
Because this resource includes an answer sheet, we recommend you print one copy of the entire file. Then, make photocopies of the blank worksheet for students to complete.
To save paper, we suggest printing this 2-page worksheet double-sided.
Additionally, project the worksheet onto a screen and work through it as a class by having students record their answers in their notebooks.
This resource was created by Leeanne Blanckensee, a teacher in Queensland and Teach Starter Collaborator.
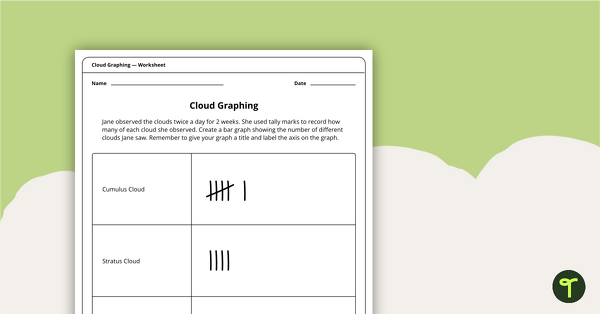
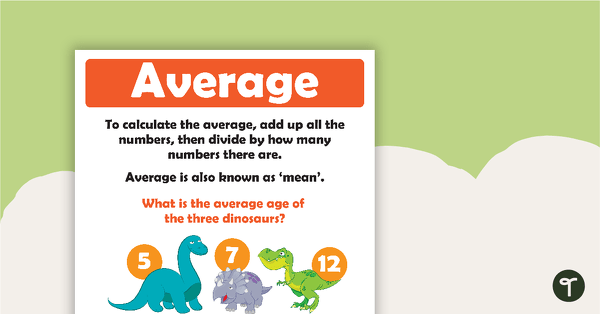
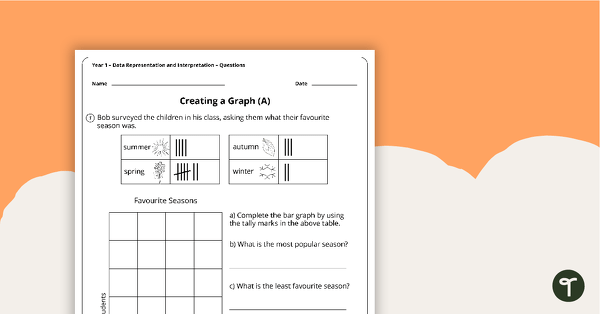
Don’t stop there! We’ve got more interpreting graphs activities to reduce your lesson planning time:
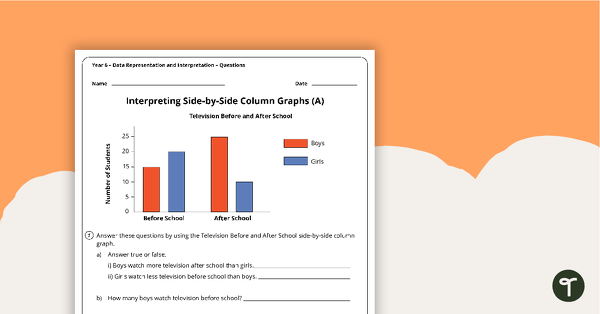
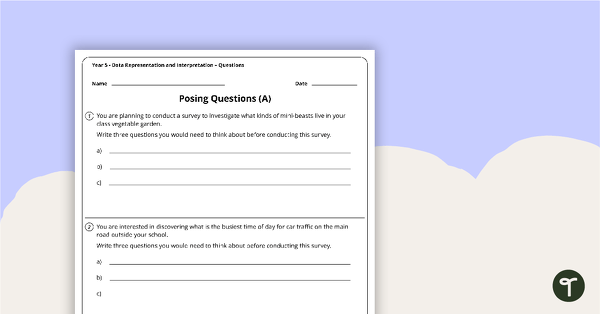
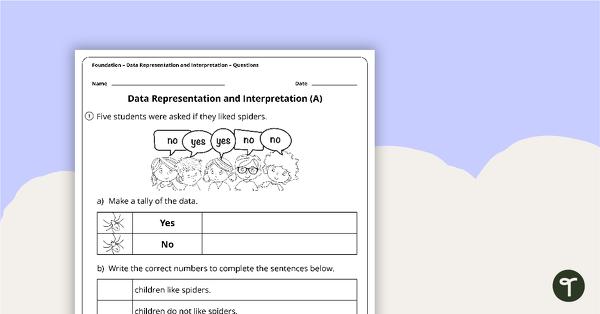
[resource:4968064] [resource:4961213] [resource:4855538]

0 Comments
Write a review to help other teachers and parents like yourself. If you'd like to request a change to this resource, or report an error, select the corresponding tab above.