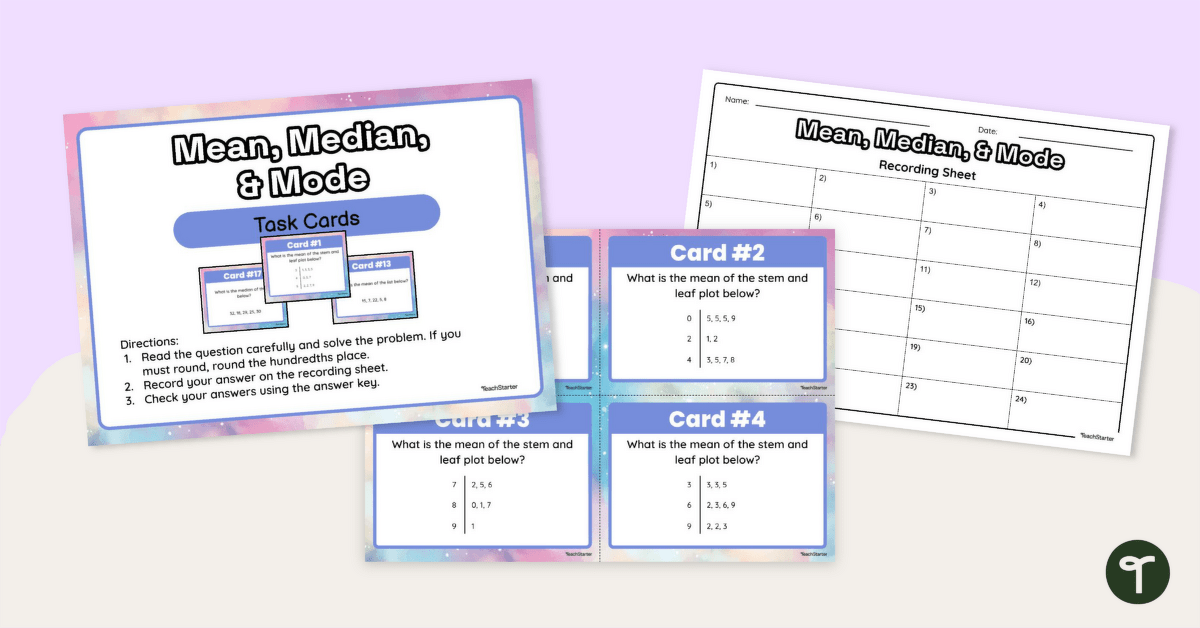
Use this set of 24 data interpretation task cards to teach students to find the mean, median and mode of a limited data set.
Teaching the Basics of Statistics and Data
If you’re teaching your Upper Primary students about data sets, you may be looking for a resource to help them differentiate between mean, median and mode (which are different measures of characteristics in any given data set).
Need a quick refresher on mean, median and mode yourself?
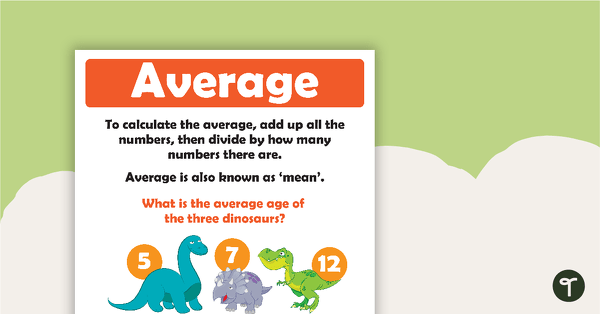
Mean: The ‘average’ of a set of numbers. To find the average, students must add together all the values in a dataset and divide that sum by the total number of values to find the mean.
Median: The median is the middle value in a sorted set of data. In case the data set has an even number of values, they learn that the median is the average of the two middle values.
Mode: The mode is presented as the value that appears most frequently in a given dataset. In primary school, the focus is on finding the mode in simple datasets with a clear mode value.
Use this collection of task card to allow students to practise finding the mean, median, and mode of small sets of data, in the form of stem-and-leaf plots and numerical lists.
To use these task cards, instruct students to:
- Read the question carefully and solve the problem. If rounding is required, they must round the hundredths place.
- Record answers on the provided recording sheet.
- Self-check their answers using the answer key provided.
Tips for Differentiation + Scaffolding
A team of dedicated, experienced educators created this resource to support your data and statistics lessons.
In addition to individual student work time, use this set of statistics task cards to enhance learning through small math groups or whole class lessons.
If you have a mixture of above and below-level learners, check out these suggestions for keeping students on track with the concepts:
🆘 Support Struggling Students
Display this Mean, Median and Mode Range poster set to provide a reminder of the definitions of each.
➕ Challenge Fast Finishers
Edit the resource in Google Slides to extend above-level learners by creating larger or more complex data sets for them to sort.
🛴 Scoot Activity
Place the cards around the room in numerical order and give each student a recording sheet. Assign students or pairs to a starting point card. Give students time to review the card and record their answers in the corresponding space on their paper. Students will rotate to the next card when you say, “SCOOT!” Continue in this manner until students return to their starting point.
👋 Exit Ticket
Use these cards as a formative assessment after your lesson. Pick a random assortment of cards and project them on the board for the whole class to see. Students can record their answers on a sheet of paper, sticky note or notebook.
Easily Prepare This Resource for Your Students
Use the dropdown icon on the Download button to choose between the PDF or Google Slides version of this resource.
Print on cardboard for added durability and longevity. Place all pieces in a folder or large envelope for easy access.
To keep the task cards out of pockets or under desks, punch a hole in the corner of each to place them on a binder ring.
Sustainability Tip: Print a few recording sheets on cardboard and slip them into write-and-wipe sleeves. Students can record their answers with a whiteboard marker, then erase and reuse them.
This resource was created by Cassandra Friesen, a Teach Starter Collaborator.
Don’t stop there! We’ve got more activities and resources that cut down on lesson planning time:
[resource:4991267] [resource:4992263] [resource:4994183]

0 Comments
Write a review to help other teachers and parents like yourself. If you'd like to request a change to this resource, or report an error, select the corresponding tab above.