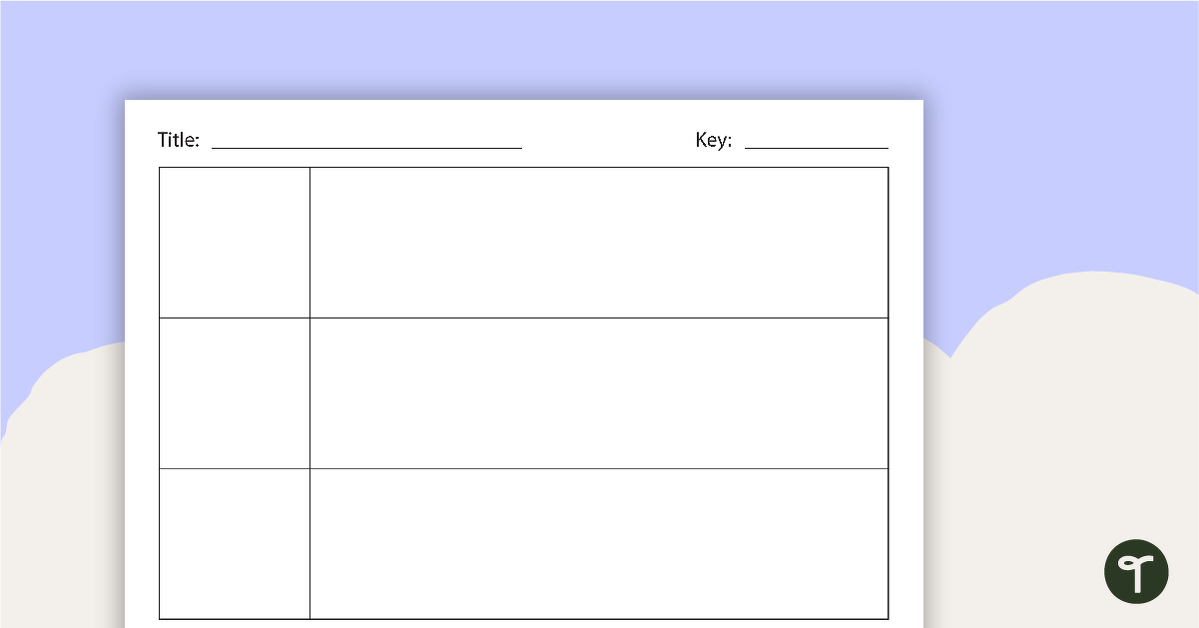
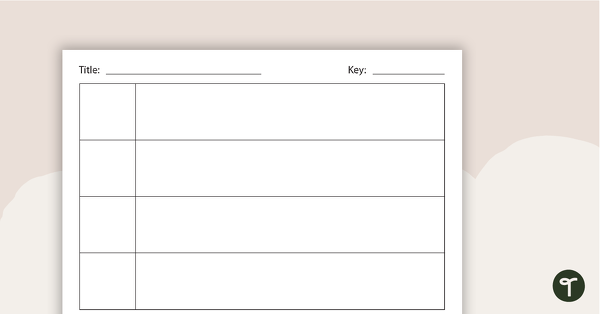
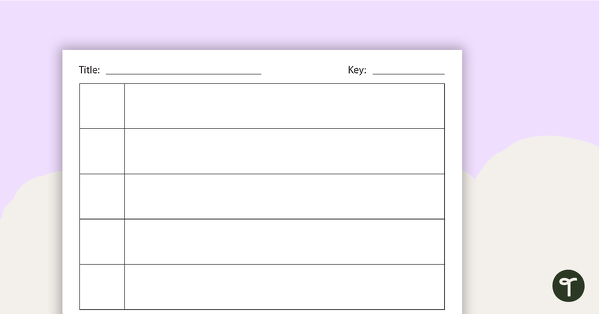
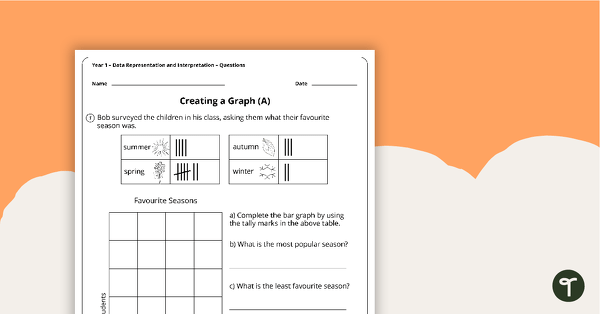
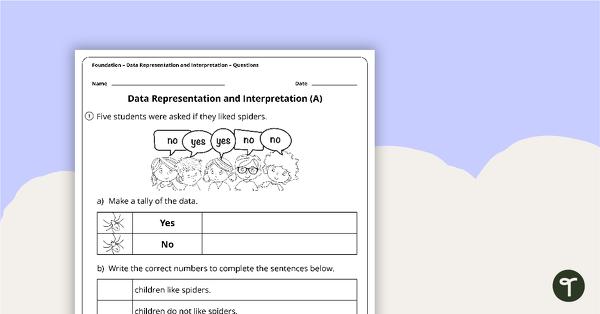
A set of blank picture graph templates for students to represent data.
Use these templates when students are representing data as picture graphs.
Students write or draw a picture in the left column indicating the different options.
They draw pictures in the rows to represent an amount for each option.
Use the ‘Key’ when one picture can represent many data values.

Can I request a column graph template also please?
Hi Elise, Thanks for your feedback! Please feel free to request a column graph template at our 'Request a Resource' page. https://www.teachstarter.com/request-a-resource/ Requests are voted on by the Teach Starter community and we create the top requests. Please let me know if you have any further questions, I’m more than happy to help.