VC2M1ST02
represent collected data for a categorical variable using one-to-one displays and digital tools where appropriate; compare the data using frequencies and discuss the findings
- creating a pictograph with objects or drawings; discussing the possible categories for the pictograph, arranging the objects or drawings into the categories; and then reflecting on the chosen categories and deciding whether they were helpful
- translating data from a list or pictorial display into a tally chart to make counting easier; describing what the tally chart is showing, by referring to the categories; using skip counting by fives to compare the numbers within each category; and explaining how the tally chart answers the question
- recognising that when there is no data for a particular category you may choose whether or not to include it in your data display, and you may use a zero or blank for that category depending on the purpose of the data collection or presentation; for example, creating a birthday calendar for the class and discussing that there are no students born in May and therefore there are no names listed
- representing data with objects and drawings where one object or drawing represents one data value, and describing the displays and explaining patterns that have been created using counting strategies to determine the frequency of responses
- exploring Aboriginal and/or Torres Strait Islander children’s instructive games, for example, Kolap from Mer Island in the Torres Strait region, recording the outcomes, and representing and discussing the results
- Free Plan
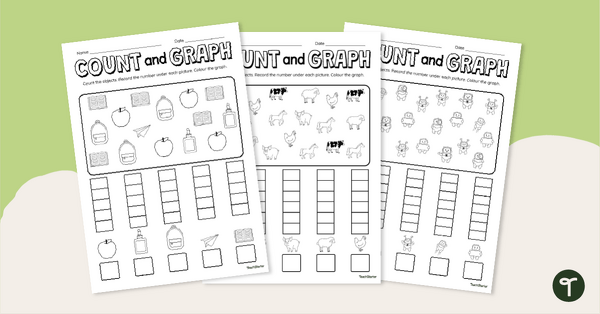
Count and Graph Worksheet Pack
Explore counting and graphing skills with this set of three worksheets.
- Plus Plan
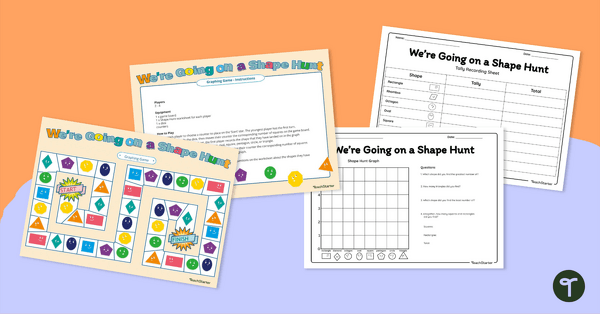
We're Going On a Shape Hunt! Graphing Game
Consolidate students' knowledge of 2D shapes while teaching about data collection, recording and graphing!
- Plus Plan
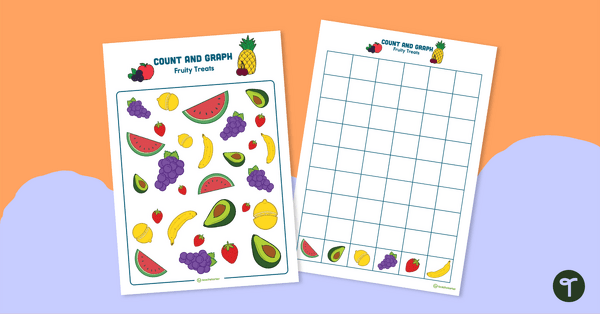
Count and Graph – Fruity Treats
A fruit-themed hands-on activity to introduce graphing skills.
- Plus Plan
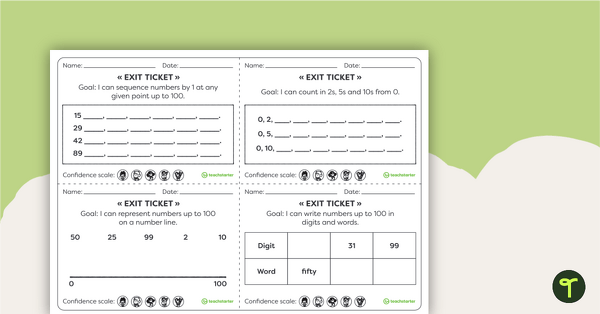
Year 1 Numeracy Exit Tickets – Worksheets
18 Numeracy Exit Ticket activities for students to provide evidence of their learning progress.
- Free Plan
How Many Bears? Graphing – Worksheet
A hands-on picture graph worksheet for students to sort and count coloured bears.
- Plus Plan
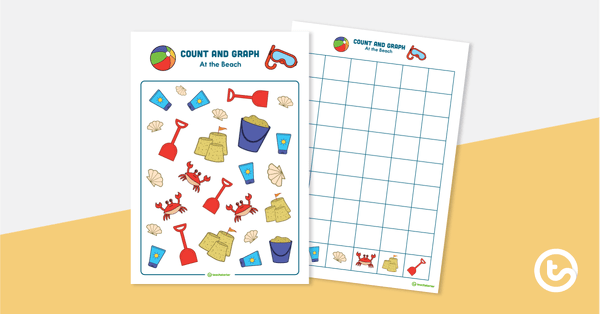
Count and Graph – At the Beach
A beach-themed hands-on activity to introduce graphing skills.
- Plus Plan

Autumn Maths Worksheet - Count and Graph Activity
Use an Autumn Maths Worksheet to practise counting and graphing.
- Plus Plan
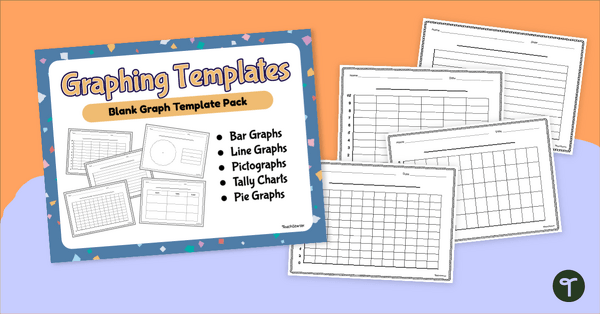
Blank Graph Template Pack
Construct your own graphs with a printable set of Blank Graph Templates.
- Plus Plan
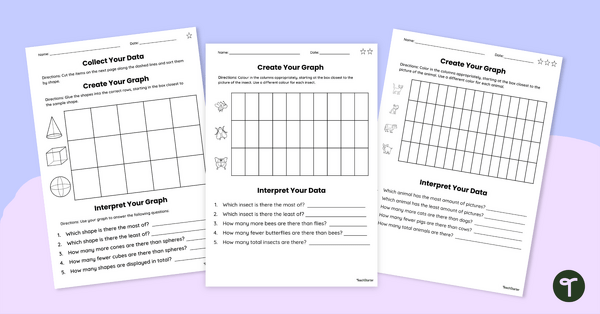
Data Collection Worksheet Set
Use this set of differentiated graphs worksheets to assess your students’ understanding of how data is collected, organised and presented.
- Plus Plan
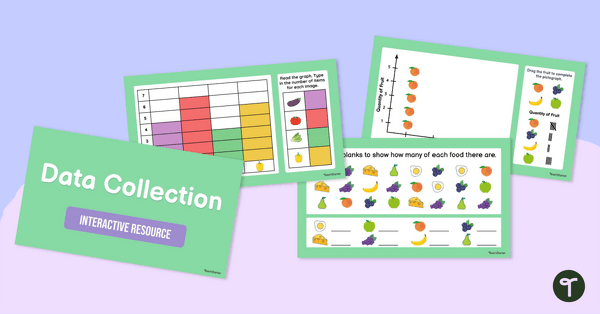
Data Collection Interactive Activity
Check your students’ understanding of interpreting data and using it to create graphs using this fun and colourful interactive game.
- Plus Plan
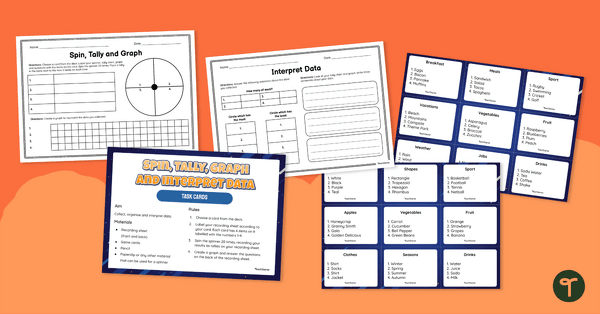
Spin, Tally, Graph and Interpret Data Task Card Activity
Guide your students to collect data, make tally marks, create a column graph and analyse data with this maths activity.
- Plus Plan
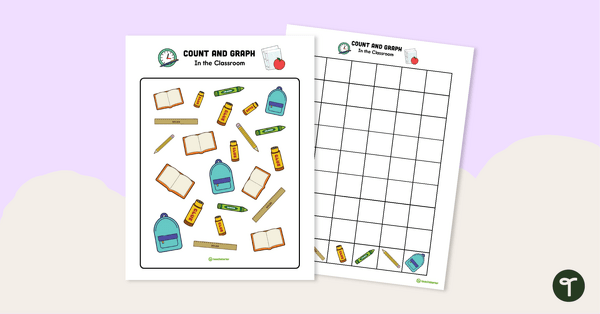
Count and Graph – In the Classroom
Practise collecting, sorting, and organising data to create a graph with this 2-page worksheet.
- Plus Plan

Types of Graphs Posters
Show students the varying data displays they will encounter in their primary maths lessons with these colourful and easy-to-digest visual posters.
- Plus Plan
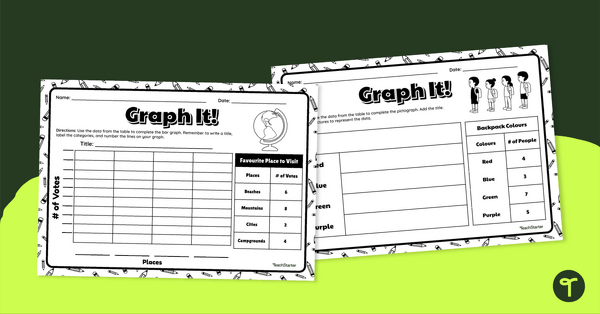
Graph It! Worksheet (Single-Unit Intervals)
Draw a single-unit picture graph and bar graph to represent data with this worksheet.
- Plus Plan
Picture Graph Playoff – Maths Game
A fun picture graph game for students to consolidate gathering and representing data.
- Free Plan

Picture Graph Templates
A set of blank picture graph templates for students to represent data.
- Plus Plan
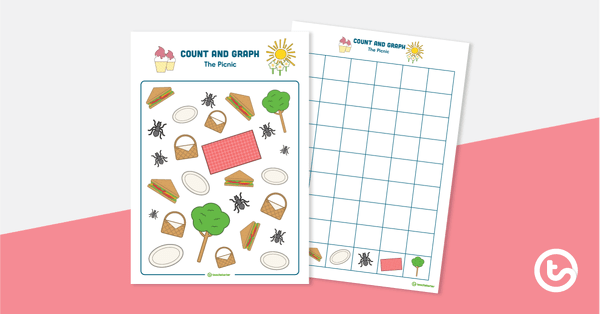
Count and Graph – The Picnic
A picnic-themed hands-on activity to introduce graphing skills.
- Plus Plan
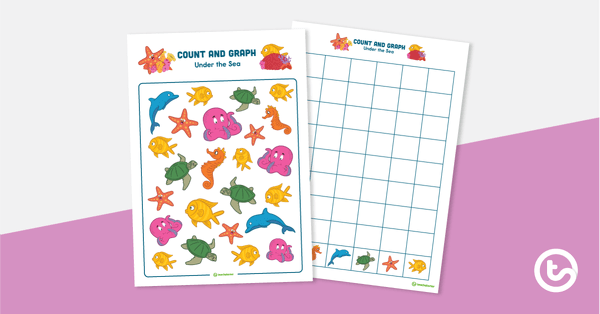
Count and Graph – Under the Sea
A sea-themed hands-on activity to introduce graphing skills.
- Plus Plan
Maths Warm Ups Interactive PowerPoint - Year 1
A PowerPoint providing a series of warm up activities for Year 1 students across the curriculum.
- Plus Plan
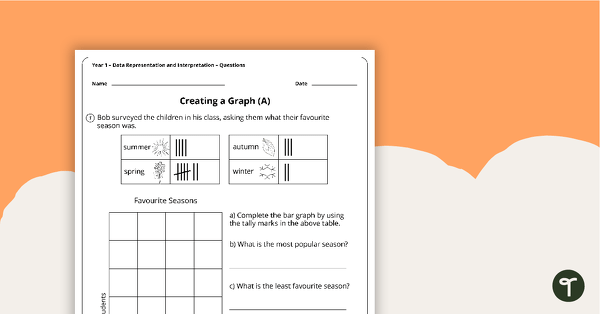
Data Representation and Interpretation Worksheets - Year 1
Two data representation and interpretation worksheets linked to the Australian Curriculum.
- Free Plan
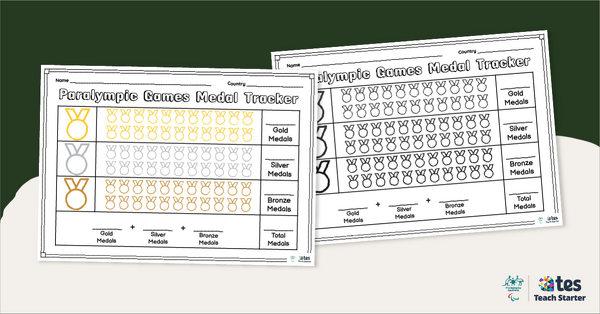
Paralympic Medal Tracking Template
Help your students keep track of the medals won during the Paralympics with our easy-to-use Paralympic medal tracker.
- Plus Plan
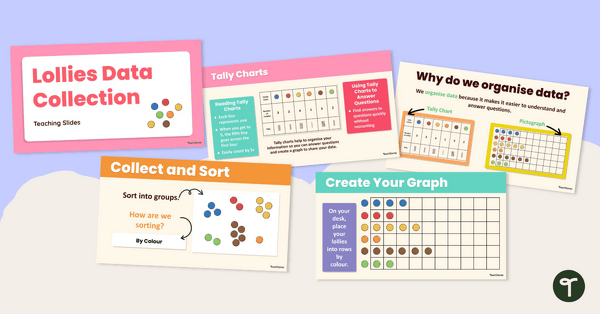
Lollies Data Collection Instructional Slide Deck
Explore this sweet-themed data collection teaching presentation to teach students the basics of recording data and creating a pictograph.
- Plus Plan
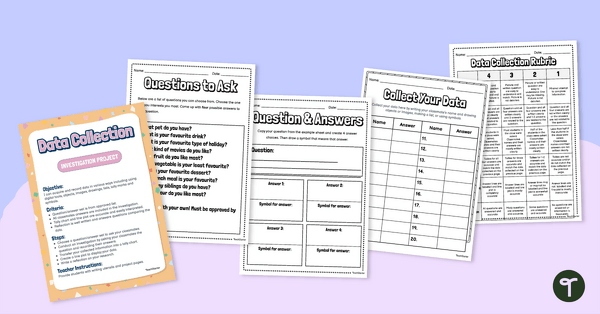
Data Collection Investigation Project
Assign this data collection project to enable students to master the skills of acquiring and recording data.
- Free Plan
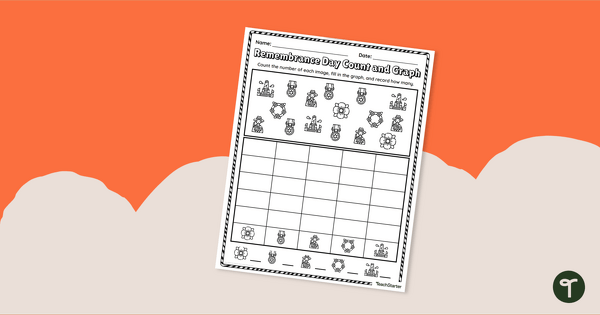
Remembrance Day Count and Graph Worksheet
Practise counting and graphing with a Remembrance Day Maths worksheet.
- Plus Plan
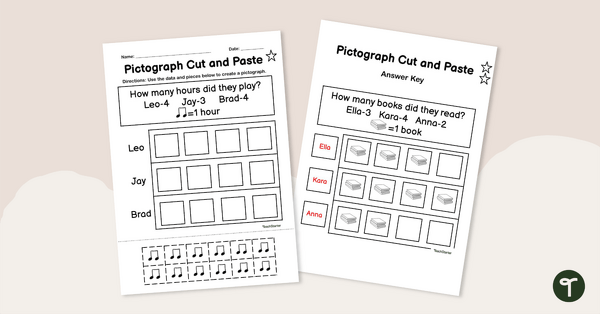
Pictograph Cut and Paste Worksheet
Use this fun cut-and-paste worksheet to consolidate student understanding of pictographs, and encourage them to practise their fine motor skills.
- Plus Plan
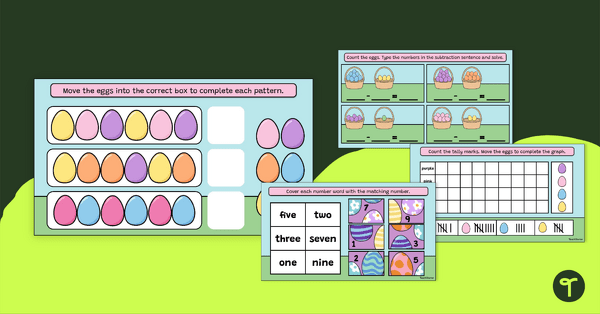
Easter Maths Digital Activities
Have some Easter fun + practise maths topics.
- Plus Plan
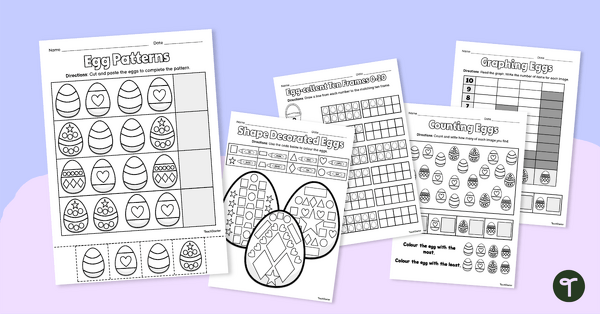
Easter Worksheets - Egg Maths
Practise a variety of early maths concepts with this pack of Easter worksheets.
- Plus Plan
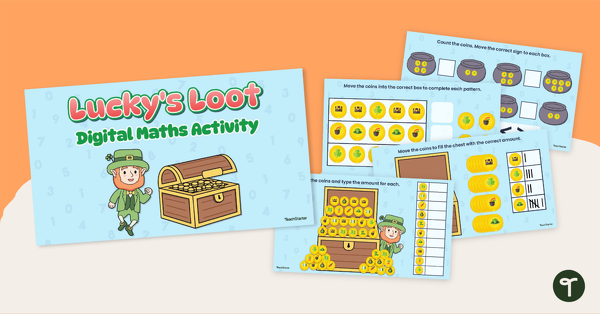
St Patrick's Day Digital Maths Activity
Celebrate St Patrick’s Day with a spot of Maths fun!
- Plus Plan
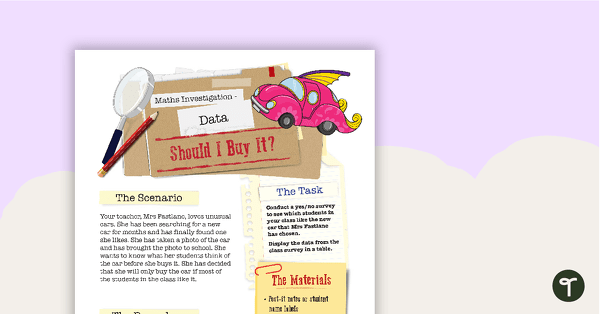
Data Maths Investigation - Should I Buy It?
A mathematics investigation involving data collection and representation, embedded in a real-world context.
- Plus Plan
Count and Graph Templates
A collection of theme-based Count and Graph templates.