VC2M3ST01
acquire data for categorical and discrete numerical variables to address a question of interest or purpose by observing, collecting and accessing data sets; record the data using appropriate methods, including frequency tables and spreadsheets
- using efficient ways to collect and record data (for example, written surveys, online surveys, polling the class using interactive digital mediums) and representing and reporting the results of investigations
- developing questions of interest and using surveys, observations or experiments to collect categorical, discrete numerical or qualitative data sets and discussing what kind of data can be used to help inform or answer the question in a statistical investigation
- using lists, tallies, symbols and digital data tables to record and display data collected during a chance experiment, for interpretation
- using different online sources to access data; for example, using online query interfaces to select and retrieve data from an online database such as weather records, data frequency mapping software such as Google Trends, or the World Health Organization
- using software to sort and calculate data when solving problems; for example, sorting discrete numerical and categorical data in ascending or descending order and automating simple arithmetic calculations using nearby cells and the summation (‘sum’) function in spreadsheets to calculate total frequencies of collected data
- Free Plan
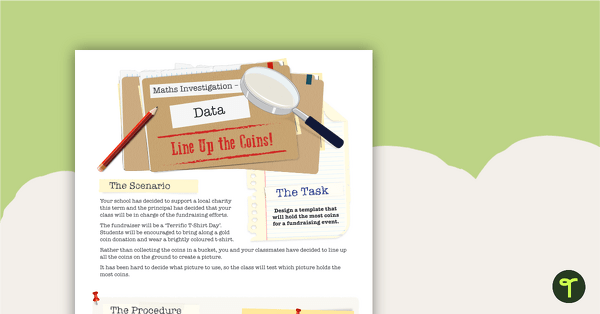
Data Maths Investigation – Line Up the Coins
A mathematics investigation about data, embedded in a real-world context.
- Plus Plan

Data Maths Investigation - Which Reward?
A mathematics investigation involving data collection and representation, embedded in a real-world context.
- Plus Plan
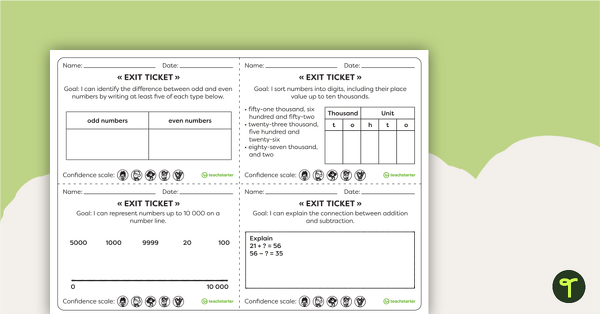
Year 3 Numeracy Exit Tickets
21 Numeracy Exit Ticket activities for students to provide evidence of their learning progress.
- Plus Plan
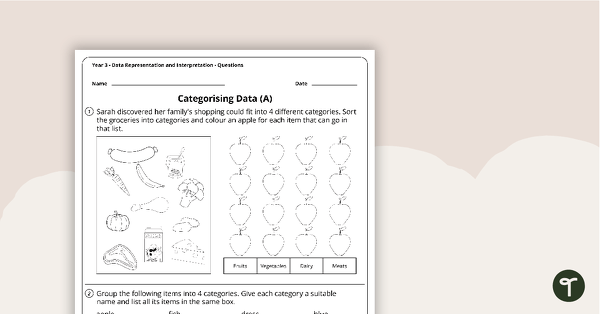
Data Representation and Interpretation Worksheets - Year 3
8 data representation and interpretation worksheets linked to the Australian Curriculum.
- Plus Plan
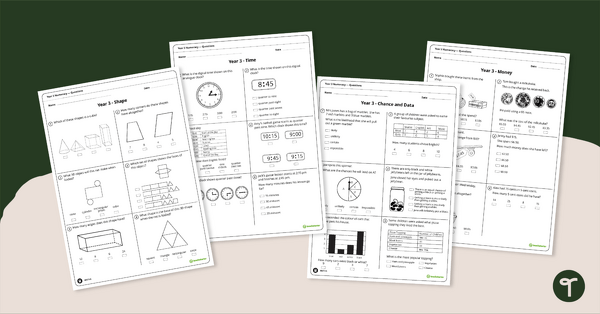
Numeracy Assessment Tool for Year 3
A set of 6 numeracy assessment tools suited to Year 3 students.
- Plus Plan
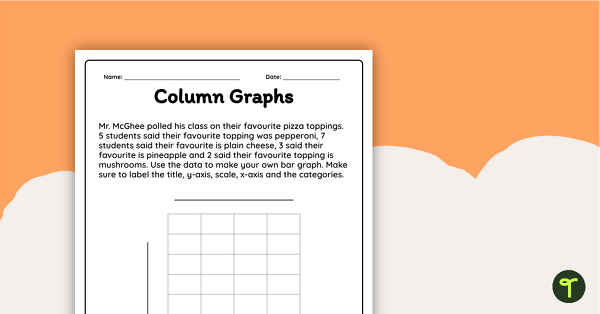
Creating a Bar Graph Worksheet
Interpret data and create a column graph display with this worksheet.
- Plus Plan
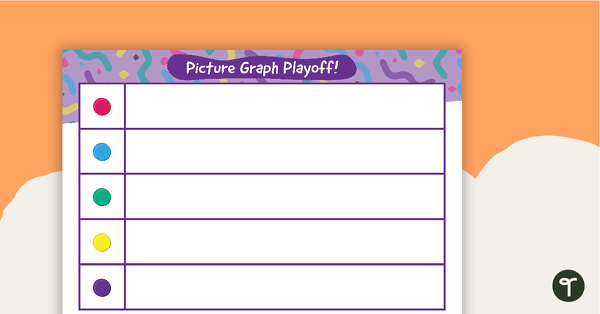
Picture Graph Playoff – Maths Game
A fun picture graph game for students to consolidate gathering and representing data.
- Free Plan

Picture Graph Templates
A set of blank picture graph templates for students to represent data.
- Free Plan

Creating a Graph Using Digital Technologies
A worksheet that supports students when collecting initial data and creating a digital graph.
- Plus Plan
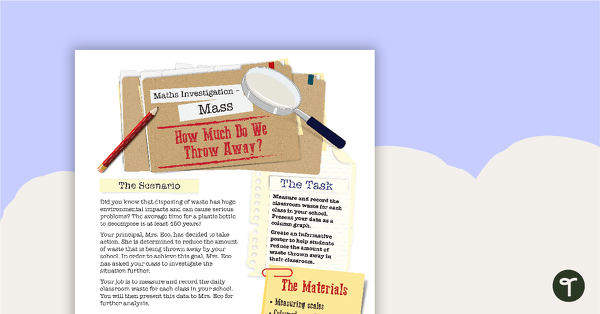
Mass Maths Investigation - How Much Do We Throw Away?
A mathematics investigation about measuring mass, embedded in a real-world context.
- Free Plan
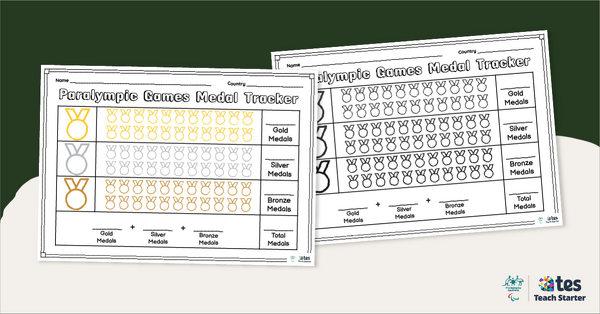
Paralympic Medal Tracking Template
Help your students keep track of the medals won during the Paralympics with our easy-to-use Paralympic medal tracker.
- Plus Plan
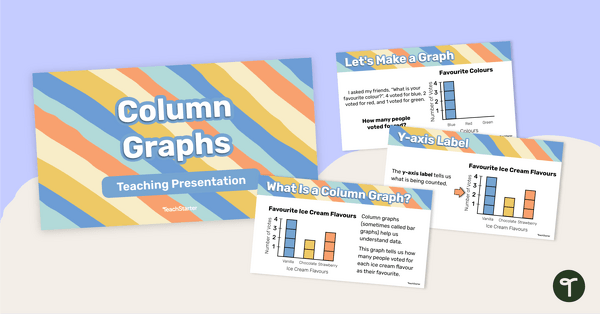
Column Graphs – Teaching Presentation
Learn all the features and how to construct a column graph with this 25-page teaching presentation.
- Plus Plan

Types of Graphs Posters and Worksheets
A collection of posters displaying the different types of graphs along with matching worksheets to assist students with laying out graphs on the page.