VC2M5ST02
interpret line graphs representing change over time; discuss the relationships that are represented and conclusions that can be made
- reading and interpreting different line graphs, discussing how the horizontal axis represents measures of time such as days of the week or times of the day, and the vertical axis represents numerical quantities or ordinal categorical variables such as percentages, money, measurements or ratings such as fire hazard ratings
- interpreting real-life data represented as a line graph showing how measurements change over a period of time, and make simple inferences
- matching unlabelled line graphs to the context they represent based on the stories of the different contexts
- interpreting the data represented in a line graph, making inferences; for example, reading line graphs that show the varying temperatures or ultraviolet (UV) rates over a period of a day and discussing when would be the best time to hold an outdoor assembly
- Plus Plan
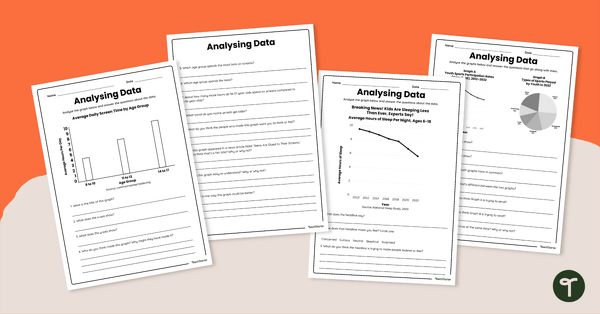
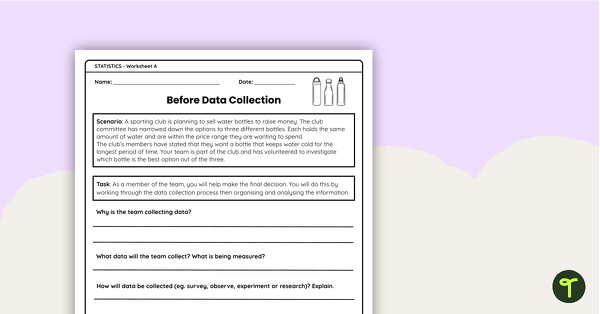
Analysing Data Worksheet Set
Share this analysing data worksheet set with your students to give them varied practice interpreting multiple data representations.
- Plus Plan
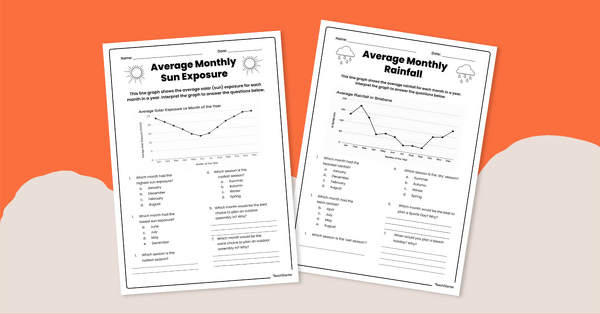
Interpreting Line Graphs Worksheet Pack
Use this set of 4 Grade 5 worksheets to help students practise interpreting real-life data represented as a line graph.
- Plus Plan
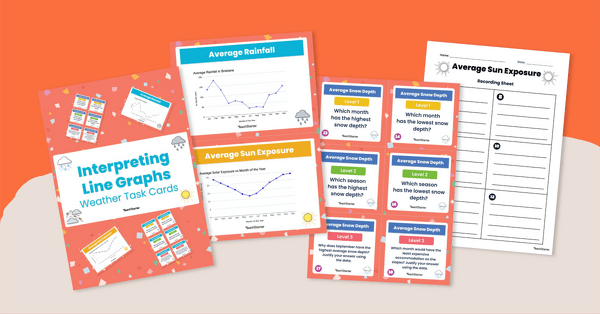
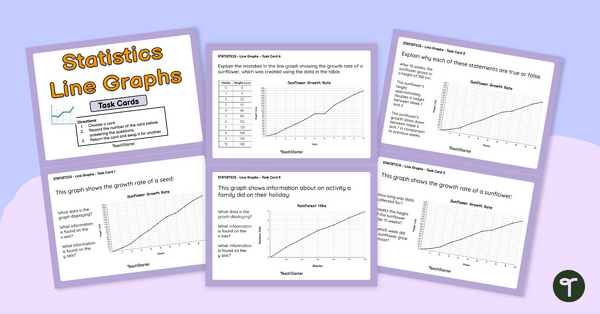
Interpreting Line Graphs Task Cards
Engage your Grade 5 learners with this task card set focused on interpreting line graphs.
- Plus Plan
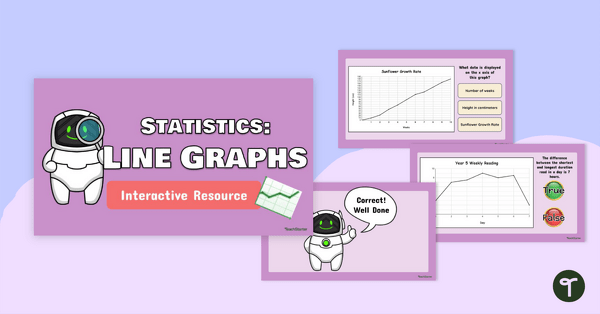
Interpreting Line Graphs Interactive Resource
Use this digital activity to teach students about interpreting real-life data represented as a line graph showing how measurements change over a period of time.
- Plus Plan
Interpreting Line Graphs Task Cards Grade 5
Use these task cards in your maths class to have students independently analyse and interpret line graphs.
- Plus Plan
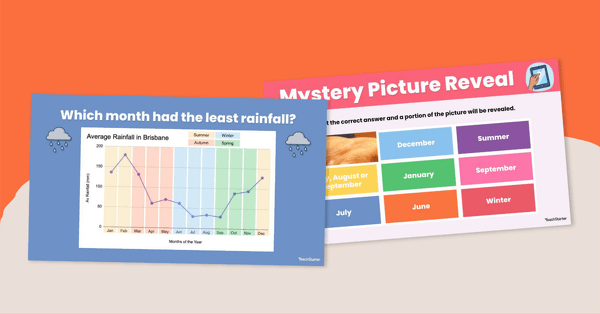
Interpreting Line Graphs Interactive Activity Grade 5
Solve the space man's line graph questions and complete the challenge with this interpreting line graphs interactive game!
- Plus Plan
Interpreting Line Graphs Grade 5 Worksheet Set
- Plus Plan

Types of Graphs Posters
Show students the varying data displays they will encounter in their primary maths lessons with these colourful and easy-to-digest visual posters.