Victorian Curriculum
VC2M6ST01
interpret and compare data sets for ordinal and nominal categorical, discrete and continuous numerical variables using comparative displays or visualisations and digital tools; compare distributions in terms of mode, range and shape
- determining the range for a numerical data set by finding the difference between the highest and the lowest value in the set and comparing the range for different data sets
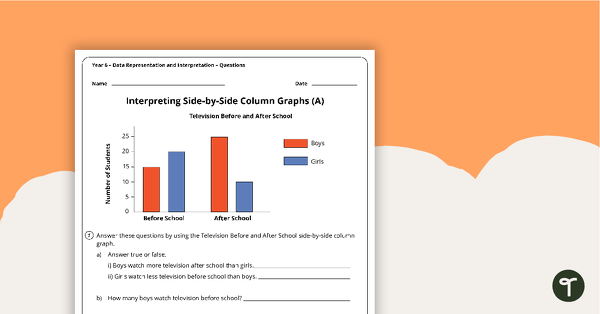
- representing acquired numerical data sets using side-by-side column graphs, comparing the spread of each data set using the range, the highest frequency for each data set using the mode, and discussing the shape
- representing ordinal data collected through surveys, using visualisation tools including dot plots and bar charts, and discussing the distribution of data in terms of shape
- using technology to access data sets and graphing software to construct side-by-side column graphs or stacked line graphs; and comparing data sets that are grouped by gender, year level, age group or other variables, and discussing findings
Show more
3
teaching resources for those 'aha' moments
- Free Plan

Chance and Data Maths Investigation - Roll Me a Six!
A mathematics investigation involving chance and data, embedded in a real-world context.
- Plus Plan

Maths Warm Ups PowerPoint - Year 6
A PowerPoint providing a series of warm up activities for Year 6 students across the curriculum.
- Plus Plan

Data Representation and Interpretation Worksheets - Year 6
8 data representation and interpretation worksheets linked to the Australian Curriculum.