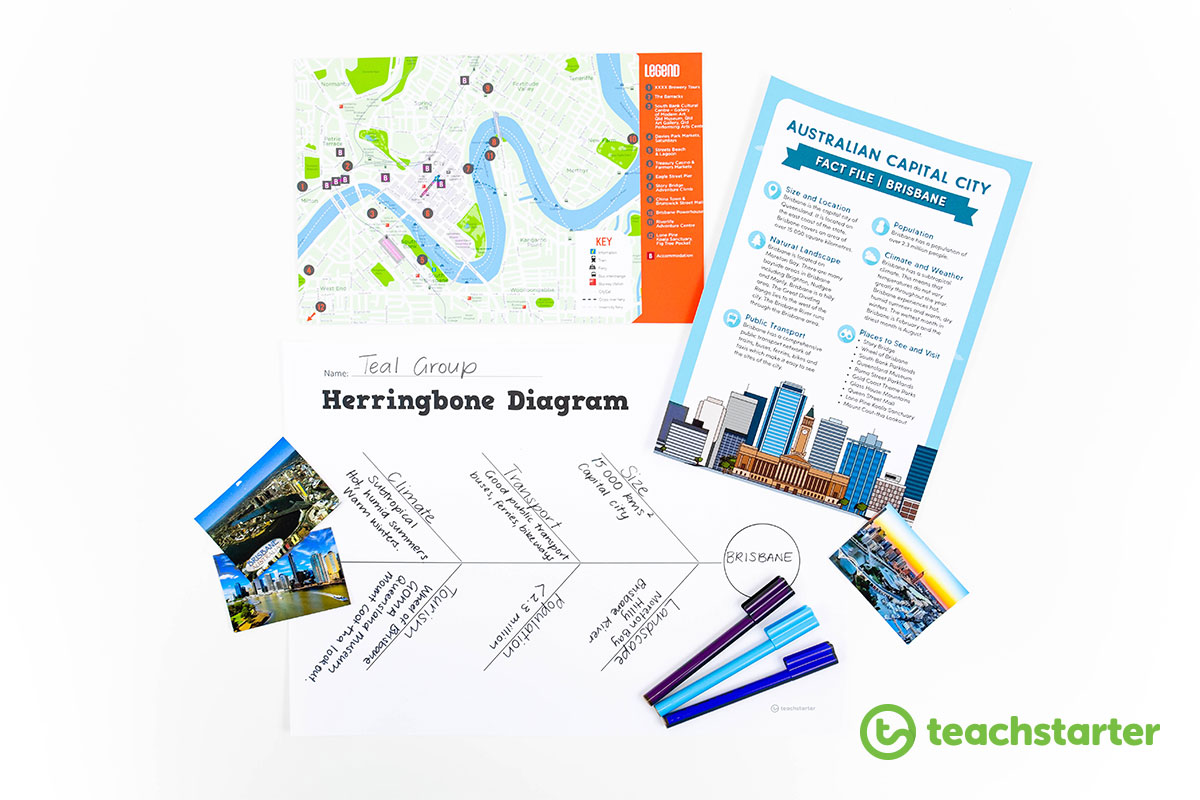
A graphic organiser is a learning tool that helps students deepen their knowledge while organising their ideas. Also known as visual organisers or graphic outlines, these nifty devices show how information is connected in a concise, logical way.
Education researchers have touted the benefits of visual learning using graphic organisers, making them a great addition to any teacher’s toolkit.
So, let’s get started! Here are eight ideas for creating engaging, interactive learning experiences using graphic organisers.
Let’s Get Visual – Explicitly Explain Graphic Organisers
One way to introduce graphic organisers is to dedicate some time to explain the purpose of each particular organiser you plan to use.
Next, supply the students with an example organiser you’ve completed as it relates to the relevant text or stimulus.
Facilitate a discussion and reflect on the effectiveness of the organiser. Brainstorm some possible applications:
- Could this be used for notetaking?
- Summarising?
- Planning a piece of writing?
- How else could we use it?
- Could we use a different organiser to better record the information?
Try a Task – Use a Graphic Organiser to Guide Learning
Another great way to show your students how effective graphic organisers are is to incorporate them into a short task.
Here’s one we prepared earlier! Our Place, Australia is a ready-to-use inquiry task focusing on the natural and human features of Australia. It’s curriculum-aligned and contains everything you need – a detailed overview, stimulus text, appropriate graphic organisers and more.
Get Hands-On with Graphic Organisers
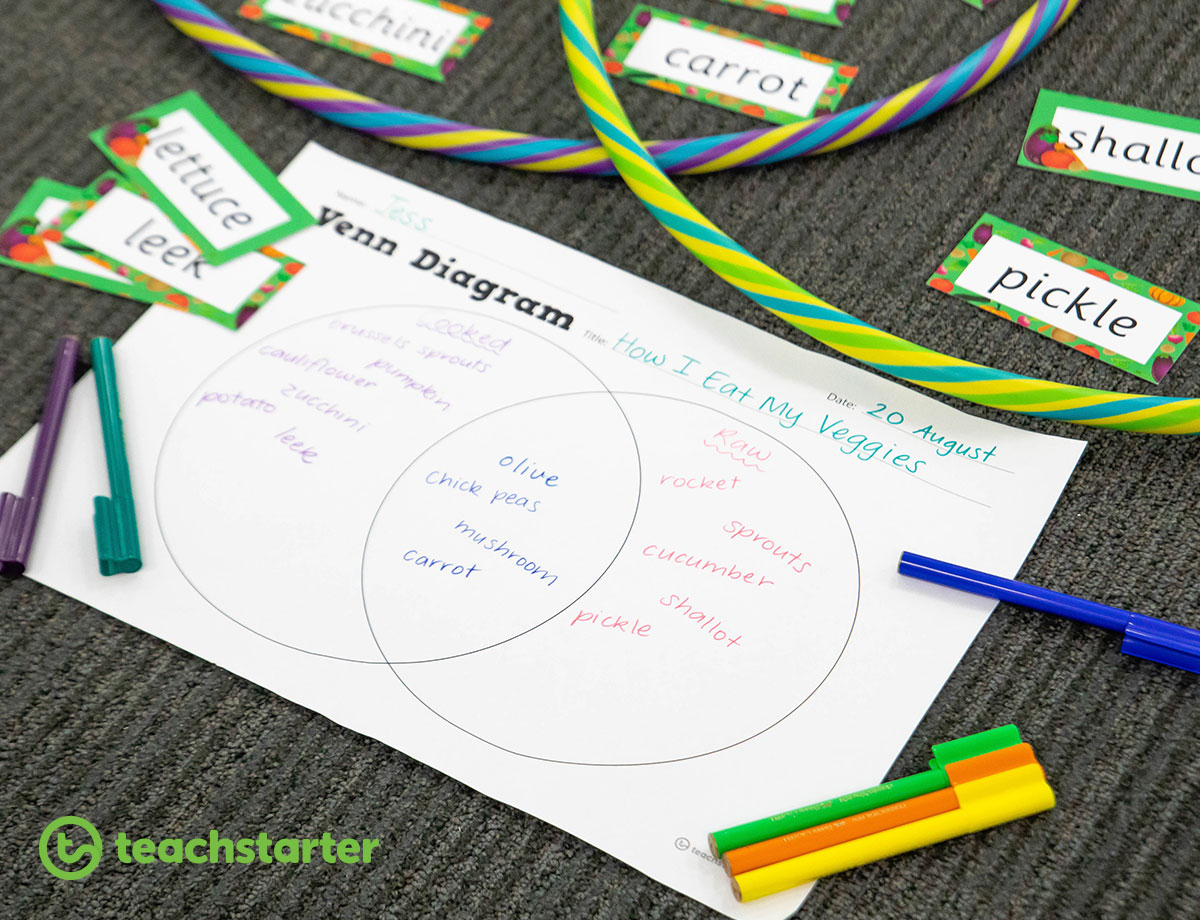
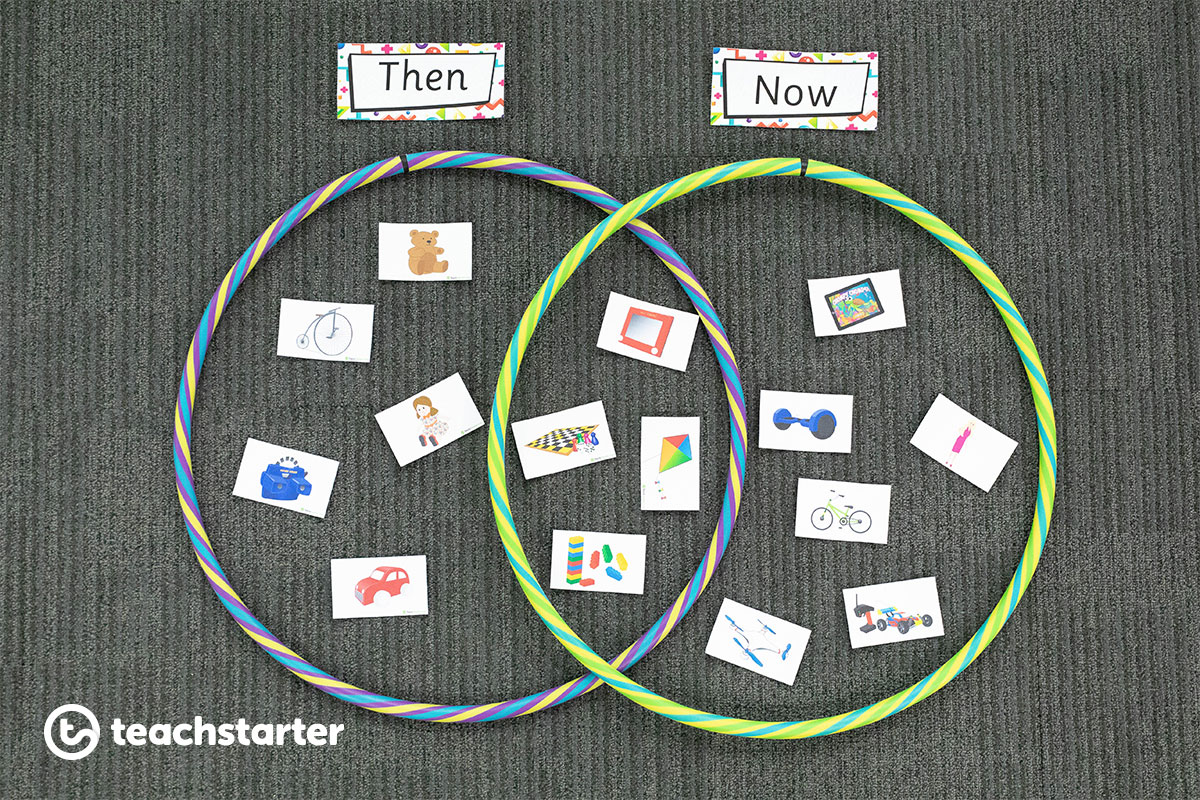
Venn diagrams are made up of overlapping circles and help students to visualise the relationship between two subjects by comparing and contrasting their similarities and differences.
Because of the simplistic nature of the Venn Diagram, it lends itself easily to early years settings.
Here, two hula hoops and our Then and Now – Toy Dominos cards are used to create a simple, yet visually effective, interactive learning experience.
Students may also enjoy drawing the Venn Diagram outside using sidewalk chalk.
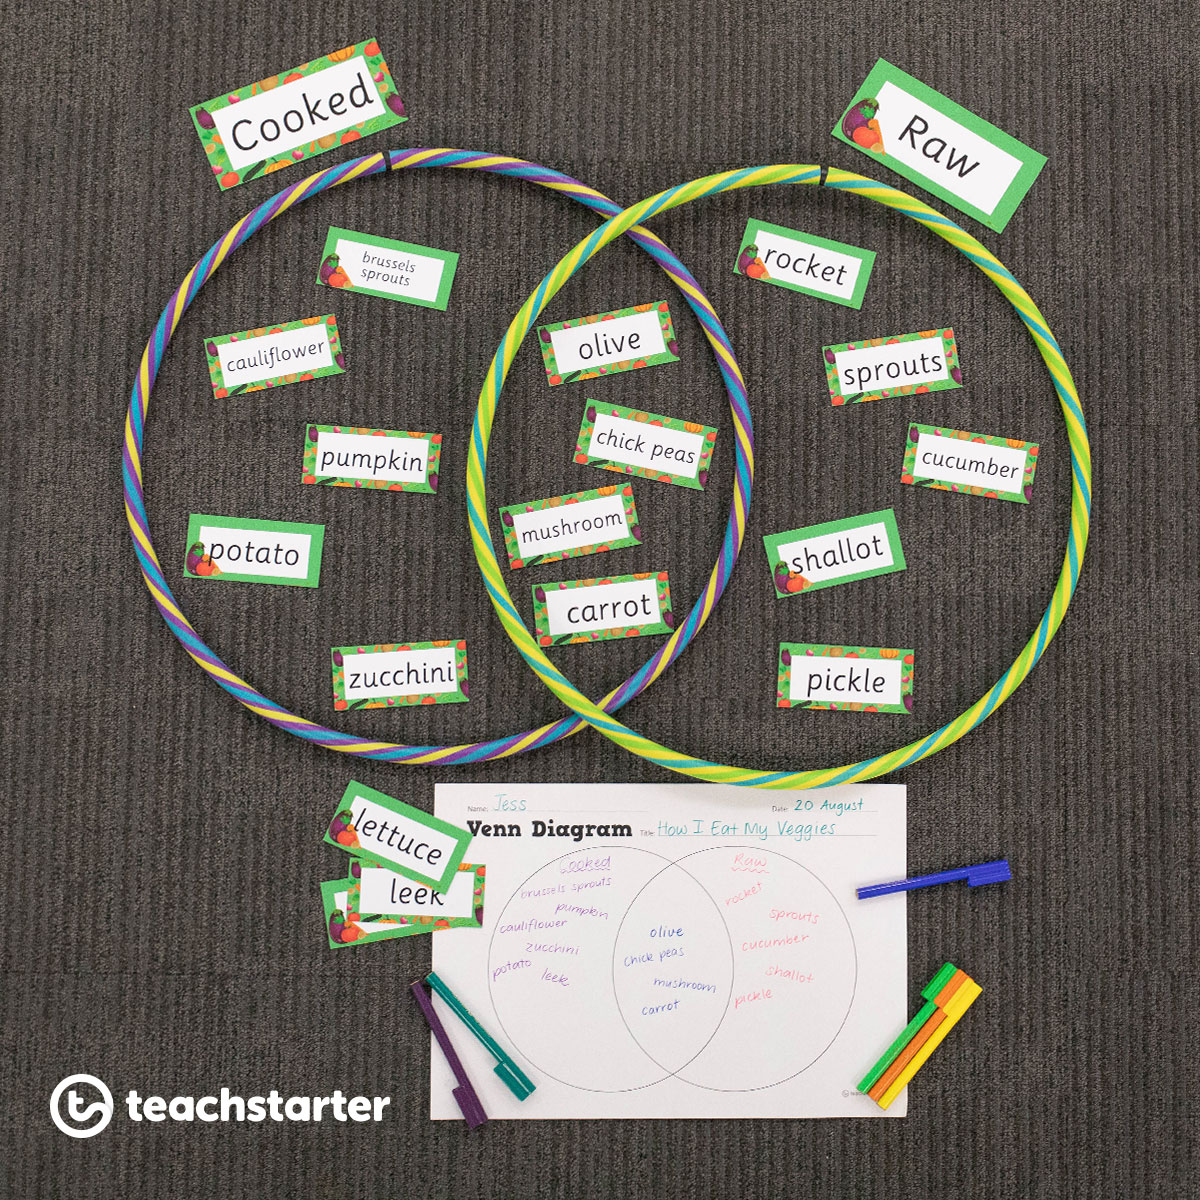
For older children, use word cards (like these from our Vegetable Word Wall Vocabulary), or have them write their own ideas on blank cards. A third hoop can be added to demonstrate more complex connections between elements.
To consolidate learning, students could record their ideas on a copy of our Venn Diagram Graphic Organiser.
Everyone’s an Expert – Use Graphic Organisers to Begin a Teaching Unit
When beginning a new unit of work and building field knowledge, students can work collaboratively to save time.
Divide the research up, assign each of your small groups an area or topic they can become experts in. Instruct small groups to record the key information on an organiser before they return to the whole group to report in their area of expertise.
As they say, knowledge is power; kids love to feel like experts (just don’t let the power go to their heads!).
Activate Prior Knowledge – Fact-Finding with Graphic Organisers
This strategy works particularly well in whole-group sessions where students are exposed to a common stimulus.
Give each student a copy of the T-Chart graphic organiser and have them label the columns: Before and After. Next, ask students to fold the sheet vertically along the centre line.
Before exposure to the stimulus material, have the students jot down some of their pre-existing knowledge of the topic. After exposing the students to the stimulus, ask them to flip over their organiser and record their new knowledge in the ‘After’ column.
When students unfold their T-Charts, they will be able to compare their understanding prior to and after their exposure to the stimulus material.
They’ll be astonished at the difference!
Delicious Graphic Organiser Displays for the Classroom
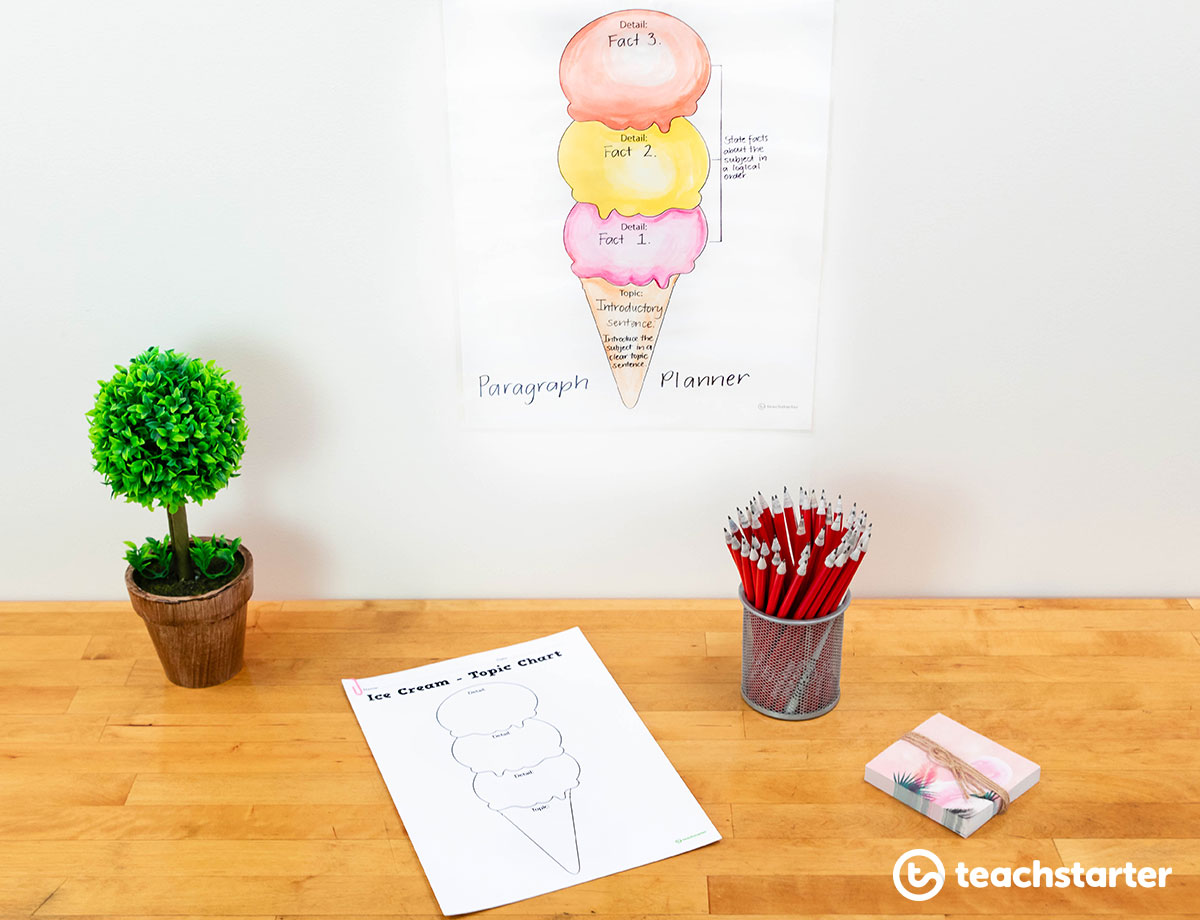
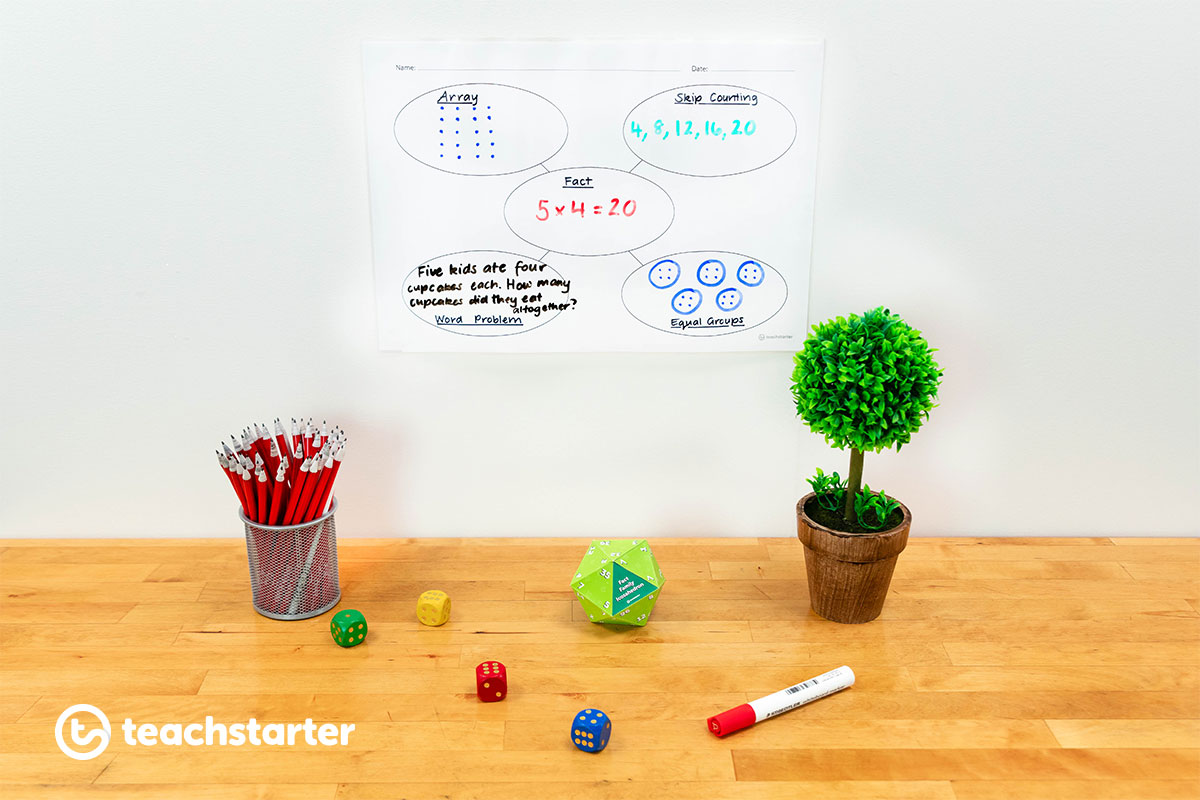
Our Graphic Organisers can all be enlarged to create eye-catching classroom displays for your students’ reference. Here, some of our popular resources from our Graphic Organiser Worksheets collection are used to display helpful information for students.
This Ice Cream Topic Chart demonstrates a paragraph plan.
Here, a basic concept map is used to show the relationship between five different representations of a multiplication fact:
Graphic Organiser Hub
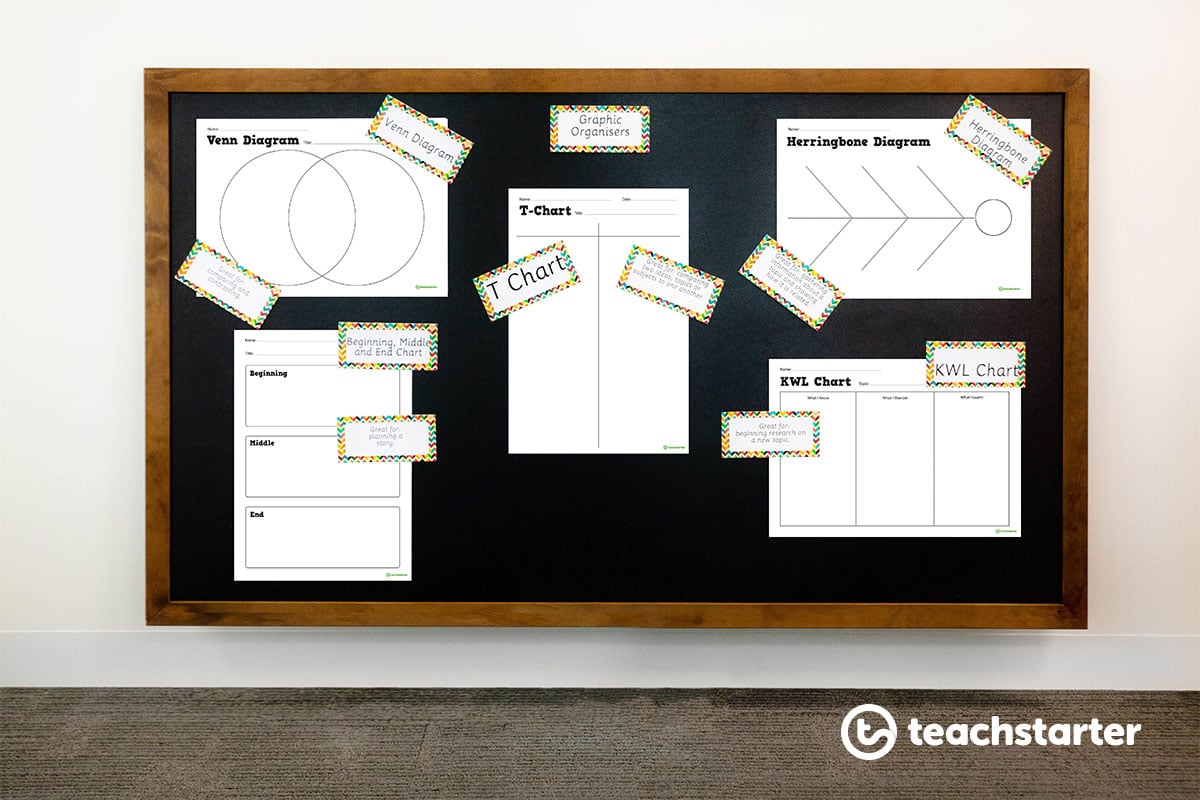
For older kids, set up an organisation station to display various types of organisers on A3 paper. Having these handy for students to access independently will have them really thinking about which organiser or map best suits their purpose.
With examples handy, students may wish to copy their own diagrams into their workbooks, minimising paper usage. It also gives them agency over their own work and allows them to try different methods of representing their ideas.
The ability to quickly draw up a simple graphic organiser is a terrific tool for students to access throughout their schooling.
“Not Notetaking!”
We know that effective summarising and notetaking is crucial for successful learning. But taking notes can be so time consuming and laborious. I can just picture the *eyerolls* I’d often get when I’d tell my students we were about to take notes!
Giving students a specifically formatted outline helps students set expectations, organise ideas into categories, and keep notes succinct. It also provides students with easy access when they need to recall information later. The Notetaking Graphic Organiser can be used in all curriculum areas.
There you have it! Eight extra ways you can incorporate graphic organisers into your teaching repertoire. Hopefully, these ideas and tips, combined with our wonderful teaching resources will have your class buzzing in no time!






Comments