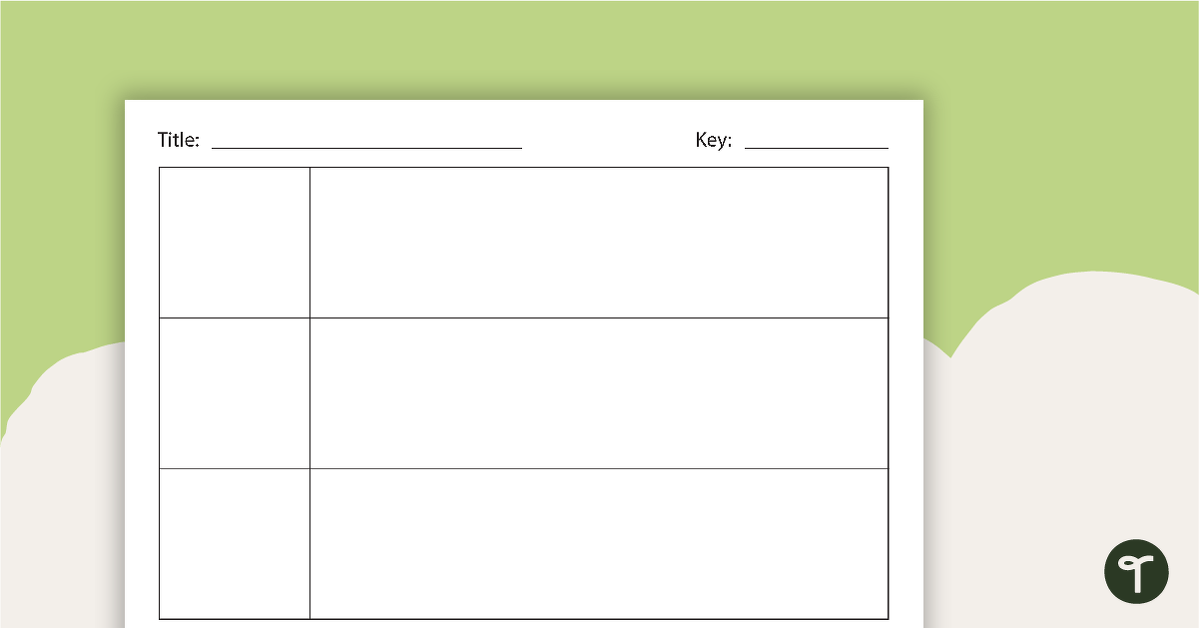
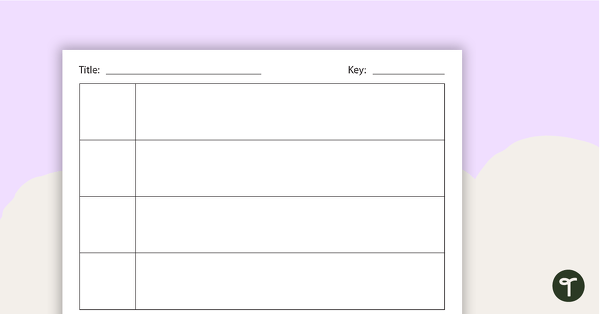
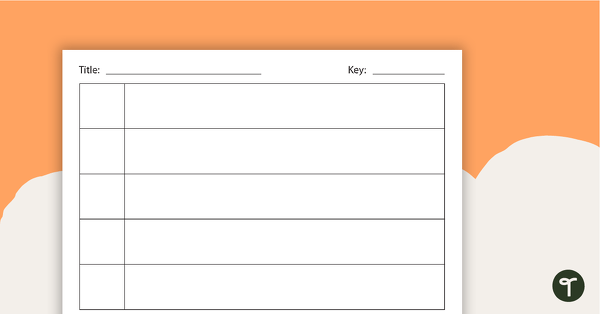
A set of blank picture graph templates for students to represent data.
Use these templates when students are representing data as picture graphs.
Students write or draw a picture in the left column indicating the different options.
They draw pictures in the rows to represent an amount for each option.
Use the ‘Key’ when one picture can represent many data values.


0 Comments
Write a review to help other teachers and parents like yourself. If you'd like to request a change to this resource, or report an error, select the corresponding tab above.