CCSS.MATH.CONTENT.6.EE.C.9
Use variables to represent two quantities in a real-world problem that change in relationship to one another; write an equation to express one quantity, thought of as the dependent variable, in terms of the other quantity, thought of as the independent variable. Analyze the relationship between the dependent and independent variables using graphs and tables, and relate these to the equation. For example, in a problem involving motion at constant speed, list and graph ordered pairs of distances and times, and write the equation d = 65t to represent the relationship between distance and time.
- Plus Plan
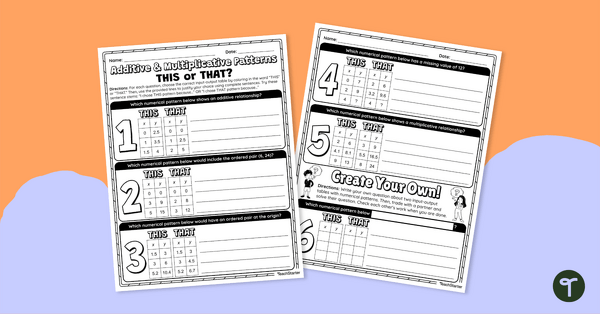
Additive and Multiplicative Relationships Worksheets PDF
Analyze number patterns with this additive and multiplicative relationships worksheets PDF that encourages students to reason logically and defend their answers.
- Plus Plan
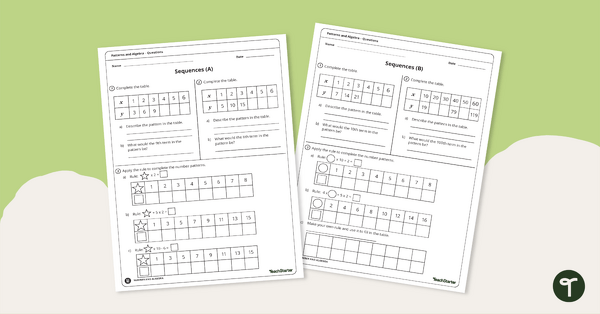
6th Grade Algebra Worksheets
Share these 6th grade algebra worksheets with your students to level up their skills in identifying and extending number patterns.
- Plus Plan
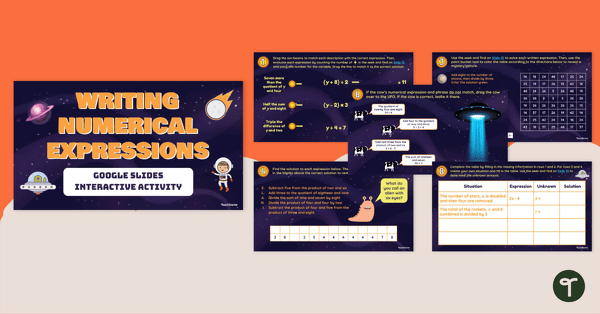
Writing Numerical Expressions – Google Slides Interactive Activity
Write and solve numerical expressions based on descriptions using a letter for the unknown quantity with this interactive activity.
- Plus Plan

Grade 6 Daily Warm-Up – PowerPoint 3
A 70-slide PowerPoint presentation containing a variety of quick warm-up activities.
- Plus Plan
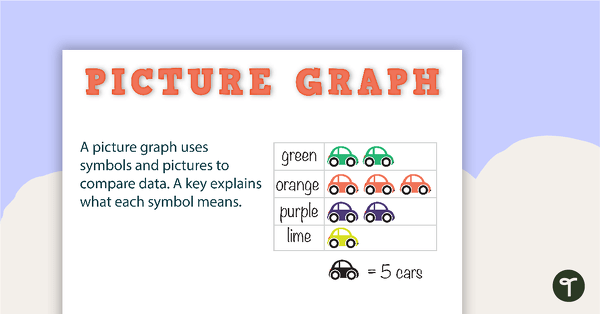
Types of Graphs Posters and Worksheets
A collection of posters displaying the different types of graphs along with matching worksheets to assist students with laying out graphs on the page.
- Plus Plan
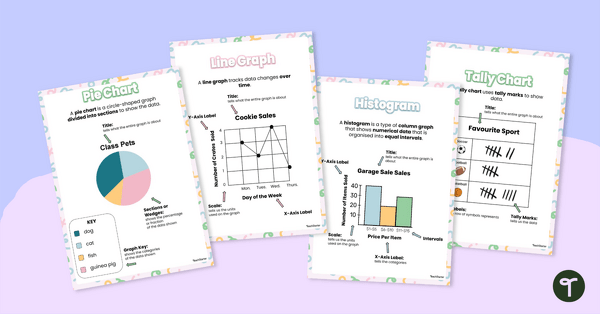
Types of Graphs Posters
This colorful and easy-to-digest visual display shows students the varying data displays they will encounter in their elementary math lessons.