Empower your students to become proficient data interpreters with this set of differentiated line plot worksheets.
Analyzing Line Plots – Worksheets for 2nd and 3rd Graders
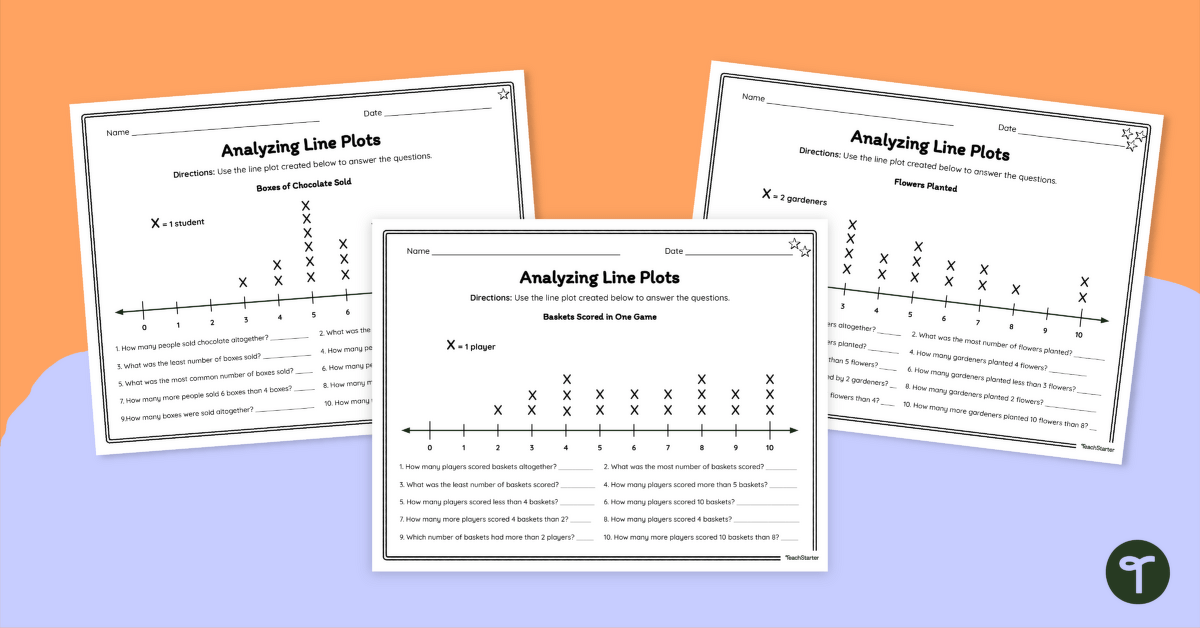
Introducing our comprehensive set of Differentiated Line Plot Worksheets, designed to cater to the diverse learning needs of students. These engaging worksheets come in three levels, each denoted by a star in the upper right-hand corner, ensuring that every student can grasp the concept of line plots at their own pace and proficiency.
🌟 Level One and Two 🌟:
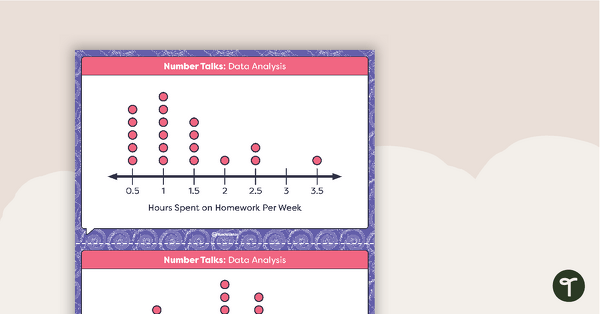
In these skill-building worksheets, students will be introduced to single-interval line plots. Students will learn to interpret and analyze data presented in a clear and concise manner. Each worksheet features a line plot representing data and students will be prompted to answer 10 targeted questions based on the graph.
🌟🌟 Level Three 🌟🌟:
For those students who are ready to take their understanding to the next level, our Level Three worksheets offer a challenge. Using scaled intervals, these worksheets provide a more complex representation of data.
An answer key is included with your download to make grading fast and easy!
Tips for Differentiation + Scaffolding
In addition to independent student work time, use this worksheet as an activity for:
- Guided math groups
- Lesson warm-up
- Lesson wrap-up
- Fast finishers
- Homework assignment
- Whole-class review (via smartboard)
If there are students in need of an added challenge, assign them the three-star version. Students can also work to collect their own data and create a line plot based off of the information.
For students who may need additional support, provide the one-star version of this resource. Students can also complete the worksheet with the help of a peer or a teacher.
Easily Download & Print Your Line Plot Worksheets
Use the dropdown icon on the Download button to choose between the PDF or editable Google Slides version of this resource.
Because this resource includes an answer sheet, we recommend you print one copy of the entire file. Then, make photocopies of the blank worksheet for students to complete.
Turn this teaching resource into a sustainable activity by printing on cardstock and slipping it into a dry-erase sleeve. Students can record their answers with a whiteboard marker, then erase and reuse them.
Additionally, project the worksheet onto a screen and work through it as a class by having students record their answers in their notebooks.
This resource was created by Brittany Kellogg, a teacher in Ohio and a Teach Starter Collaborator.
Don’t stop there! We’ve got more activities to shorten your lesson planning time:
[resource:4840933] [resource:4840833] [resource:2652042]

0 Comments
Write a review to help other teachers and parents like yourself. If you'd like to request a change to this resource, or report an error, select the corresponding tab above.