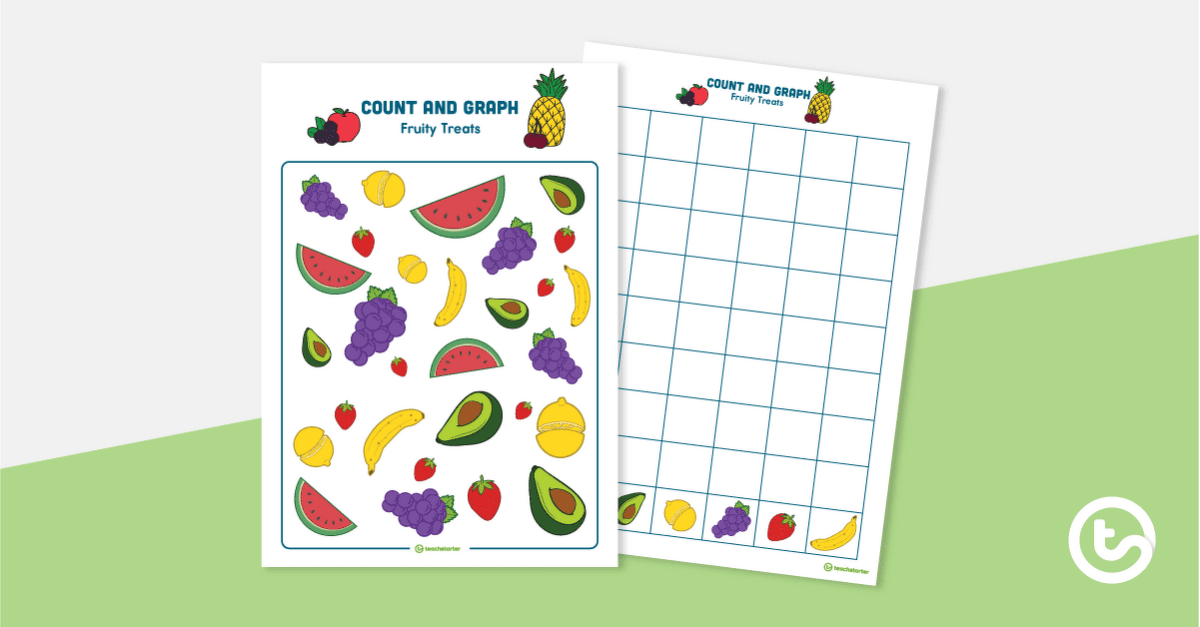
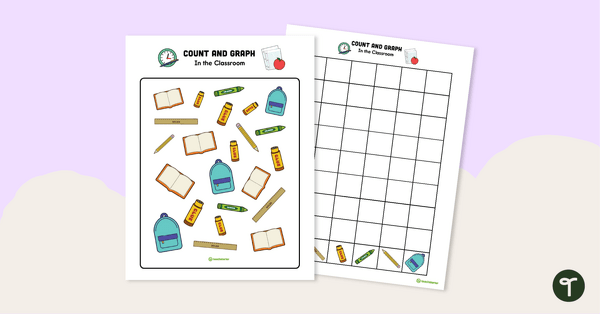
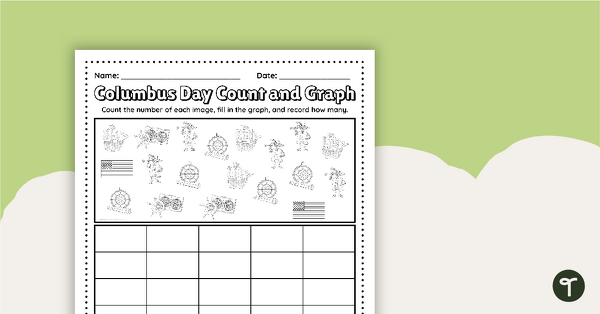
Practice collecting, sorting, and organizing data to create a graph with this 2-page worksheet.
Looking for a way to encourage counting skills and initiate the understandings of creating graphs at the same time? As you lay the foundations for using bar graphs, are you after an alternative to picture graphs? Then, this is the resource for you!
Search and Find
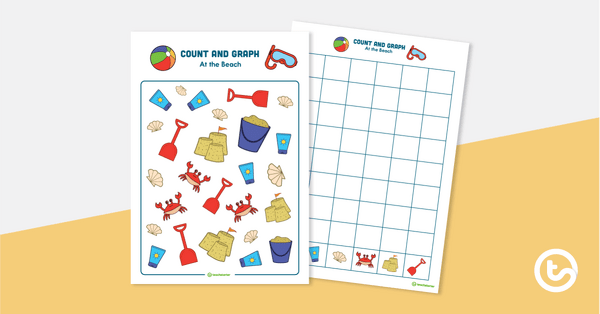
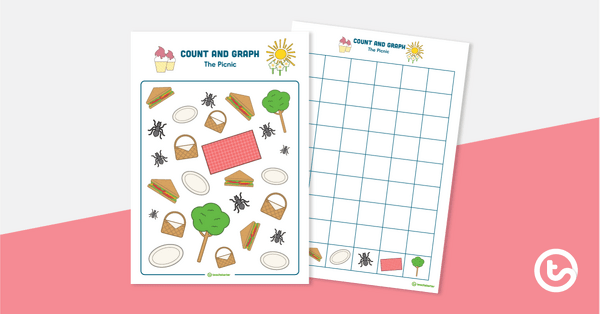
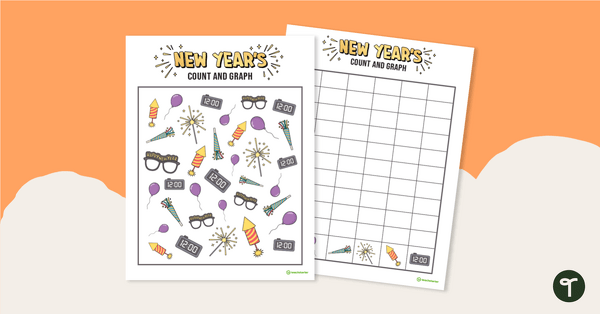
Most students love search and find activities. Foster your budding data analysts with this appealing search-and-find worksheet and its matching blank graphing sheet.
Students count the number of items specified and then use small manipulatives (such as counters, buttons, etc) as markers. They place their markers on the graphing template in the correct boxes, thus creating a data display with concrete objects. Once students know their information is correct, they color each square where they have placed a manipulative.
Easily Prepare This Resource for Your Students
To turn this teaching resource into a math center or sustainable activity, print a few graphing sheets on cardstock and slip them into dry-erase sleeves. Students can color in the squares with a dry-erase marker, then erase and reuse.
Before You Download
Use the drop-down icon on the Download button to choose between the color or black and white version of this resource.
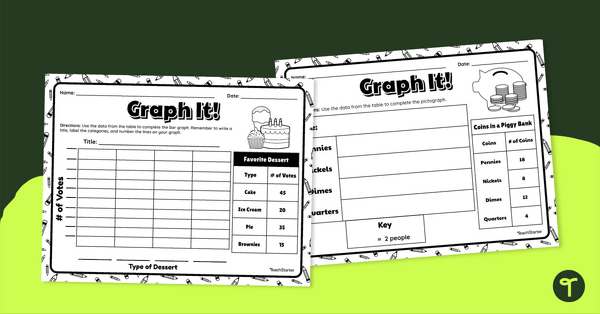
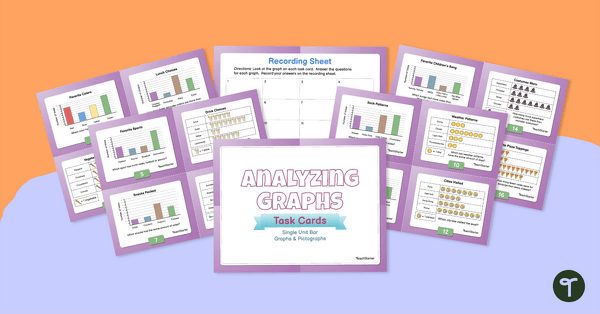
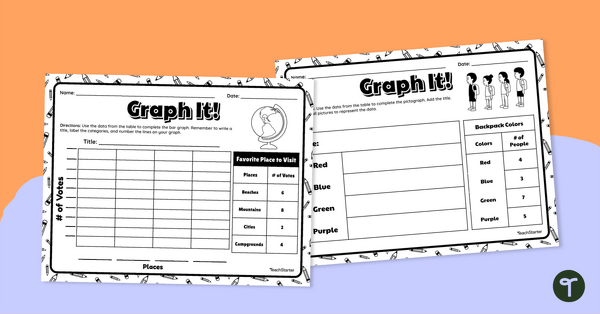
Looking for other graphing and data resources? We’ve got you covered! Click on the links below.
teaching resource
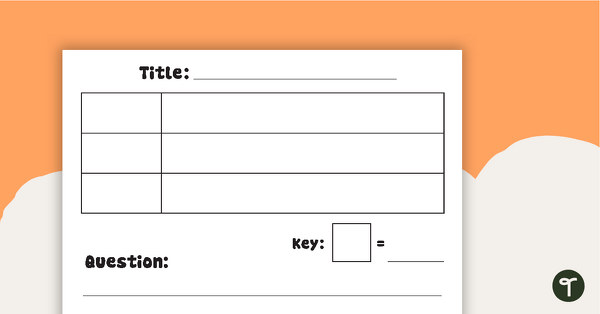
Picture Graph Templates
A set of blank picture graph templates for students to represent data.
teaching resource
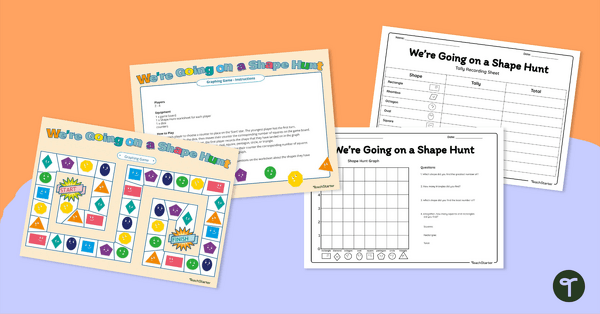
We're Going On a Shape Hunt! Graphing Game
Consolidate students' knowledge of 2D shapes while teaching about data collection, recording and graphing!

0 Comments
Write a review to help other teachers and parents like yourself. If you'd like to request a change to this resource, or report an error, select the corresponding tab above.