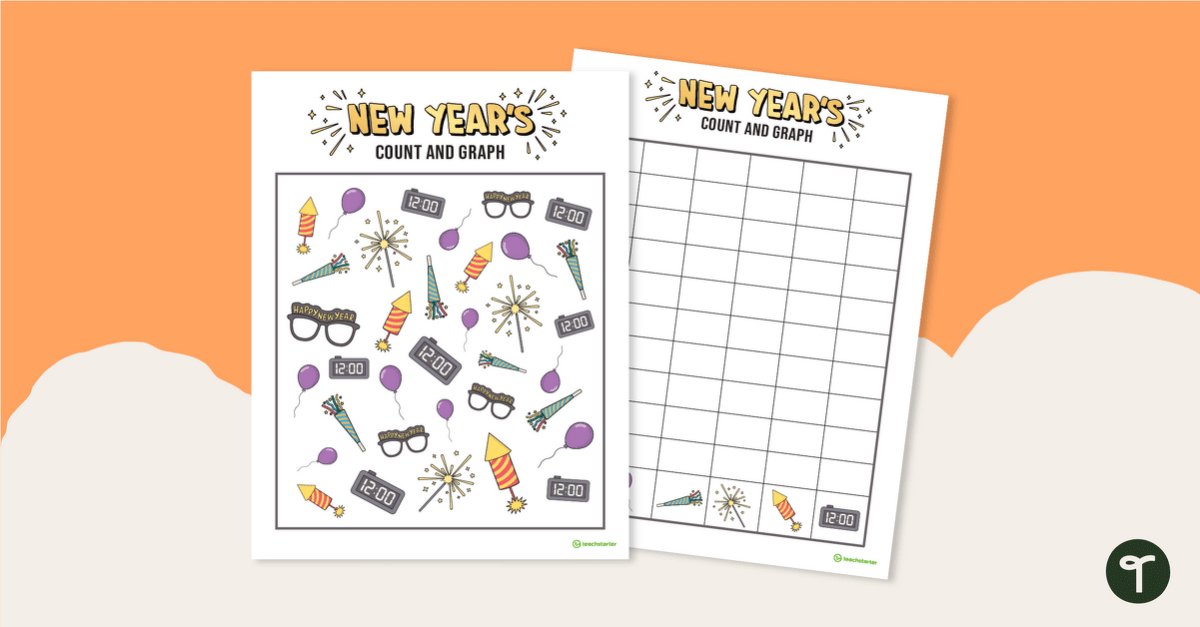
Celebrate the new year by counting festive images and notating their totals as a bar graph.
Graphs Practice — Curriculum Goals
Use this classroom activity in the weeks leading up to New Year’s Eve or after returning from winter break.
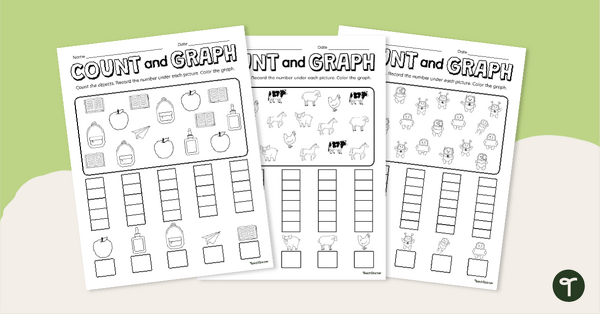
This is a 2-page worksheet in which students will practice showing bar graph representations for numbers. Students will locate the New Year’s images in the scene provided and use the grid on page 2 to shade in bar graph lines representing each image’s total number.
An answer key is included for quick grading or students to self-check their work during independent review.
By completing this activity, students demonstrate they can use data to create real‐object and picture graphs.
Scaffolding + Extension Tips
In addition to individual student work time, use this graphing worksheet as a:
- Math center activity
- Post-lesson exit ticket
- Homework assignment
- Whole-class review (via smartboard)
Got fast finishers? Students who need a challenge can recreate their bar graph as a picture graph by drawing the images in the spaces provided (or on a separate sheet of paper).
Students who need extra support can use manipulatives, putting one in each space as they count to identify the total number of squares to shade in.
Prepare This Resource In A Variety Of Ways
Because this resource includes an answer sheet, we recommend you print one copy of the entire file. Then, make photocopies of the blank worksheet for students to complete.
To save paper, we suggest printing this 2-page worksheet double-sided.
You can also turn this teaching resource into a sustainable activity! Print a few copies on cardstock and slip them into dry-erase sleeves. Students can record their answers with a dry-erase marker, then erase and reuse.
Additionally, project the worksheet onto a screen and work through it as a class by having students record their answers in their notebooks.
Before You Download
Use the dropdown icon on the Download button to choose between the PDF or Google Slides version of this resource. An answer key is also included with this download.
Get more handy worksheets here!
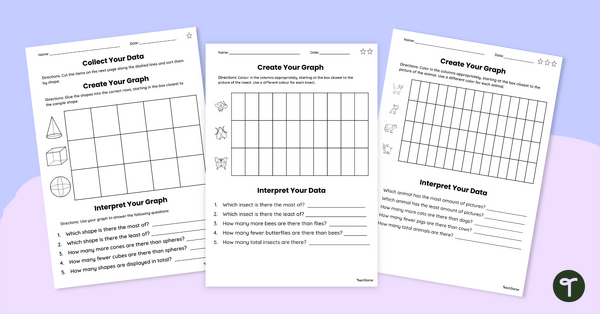
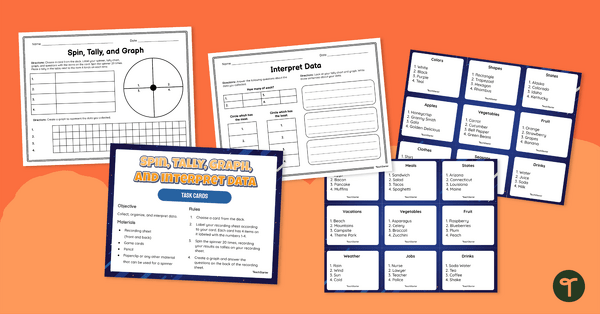
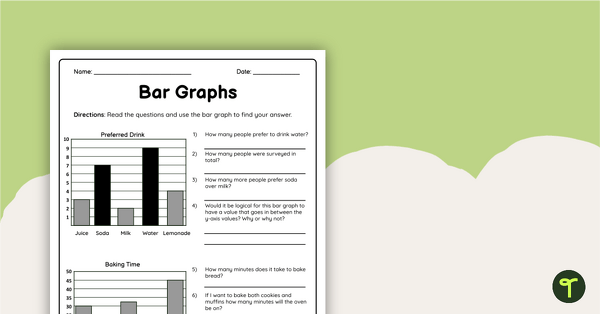
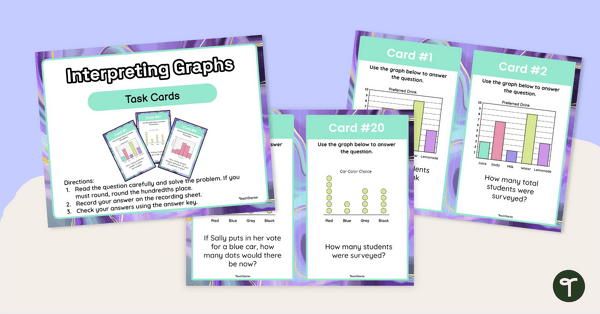
Don’t stop there! We’ve got more graphing activities to cut down on lesson planning time:
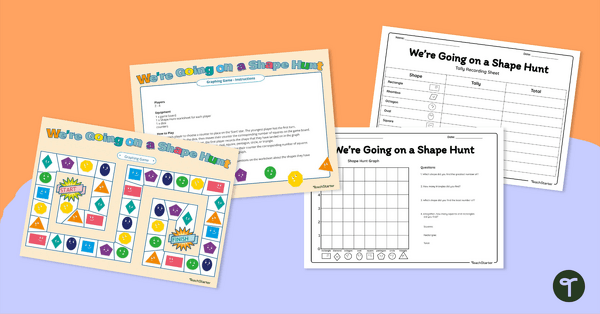
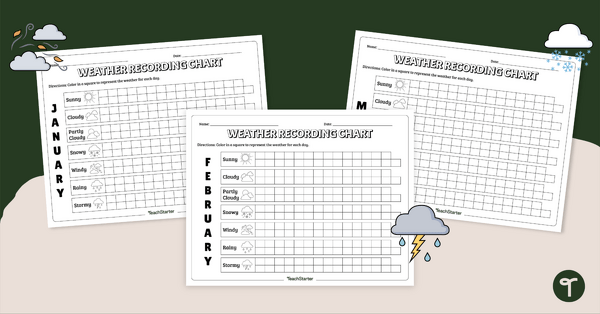
This colorful and easy-to-digest visual display shows students the varying data displays they will encounter in their elementary math lessons. Consolidate students' knowledge of 2D shapes while teaching about data collection, recording and graphing! Use these printable weather charts to graph and analyze the weather for each month.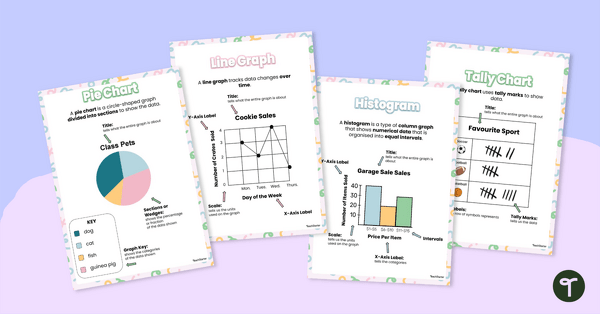
teaching resource
Types of Graphs Posters
teaching resource
We're Going On a Shape Hunt! Graphing Game
teaching resource
Printable Weather Recording Charts

0 Comments
Write a review to help other teachers and parents like yourself. If you'd like to request a change to this resource, or report an error, select the corresponding tab above.