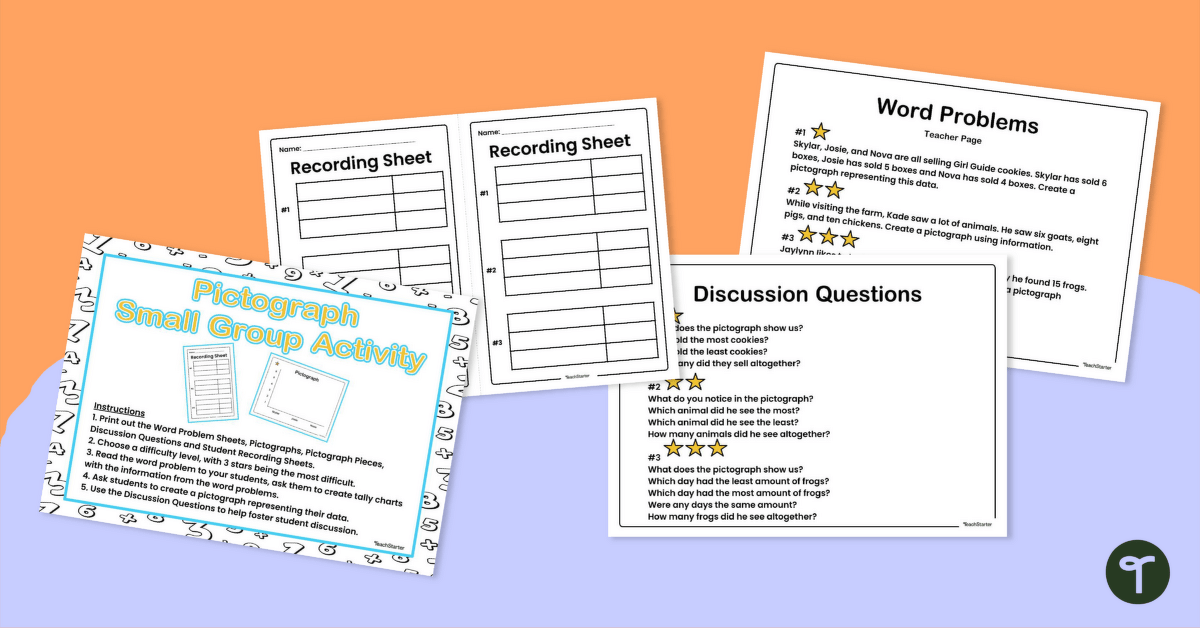
Teach students how to create simple pictographs using data from word problems with this small group activity.
Pictograph Fun! Using Data to Create Simple Pictographs
If your young students are discovering the fun of pictographs, this resource is just what you need! Perfect for small-group or individual work time, these differentiated cards provide simple instructions to gradually display more complex data as pictographs.
This resource kit contains:
- directions,
- sheet of 3 leveled word problems,
- sheet of discussion questions,
- 3 pictographs and pieces, and
- answer keys
What is a Pictograph?
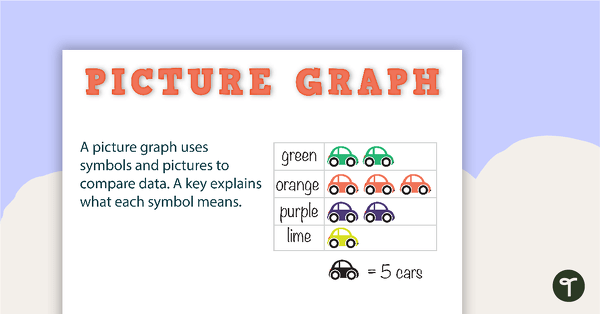
A picture graph, or pictograph, is a visual representation that uses pictures or symbols to convey information or data. Each picture or symbol represents a specific number of objects on the graph and is noted in a graph’s key. If no key is provided for a graph, each picture represents 1.
Tips for Differentiation + Scaffolding
A team of dedicated, experienced educators created this resource to support your pictograph lessons.
In addition to individual student work time, use this graphing activity to enhance learning through guided math groups, whole class lessons, or individual assessment tasks.
If you have a mixture of above and below-level learners, check out these suggestions for keeping students on track with the concepts:
🆘 Support Struggling Students
Choose the lowest difficulty level (⭐) and guide students when completing the recording sheets.
➕ Challenge Fast Finishers
Choose the highest difficulty level (⭐⭐⭐), then ask students to complete basic computations using the graph’s data.
Ask students to create their own word problems and graphs and record them in their math journals.
Easily Prepare This Resource for Your Students
Use the dropdown icon on the Download button to choose between the PDF or Google Slides version of this resource. A recording sheet and answer key are also included with this download.
This resource was created by Brittany Kellogg, a teacher in Ohio and a Teach Starter Collaborator.
Don’t stop there! We’ve got more pictographs activities and resources that cut down on lesson planning time:
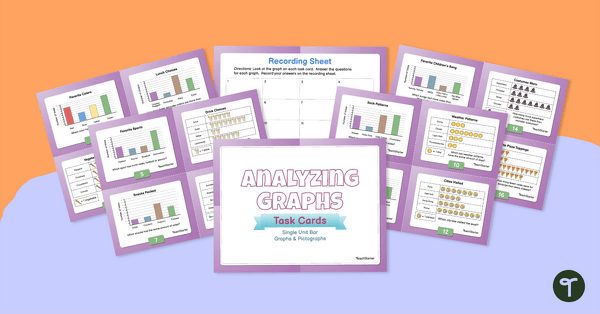
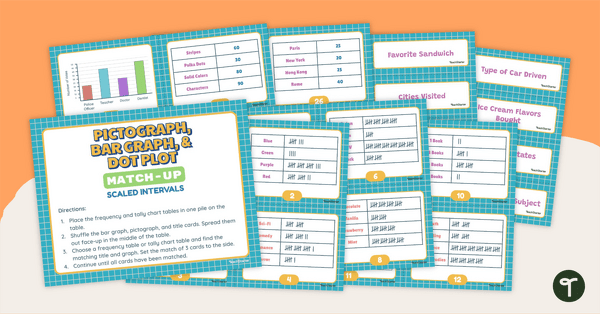
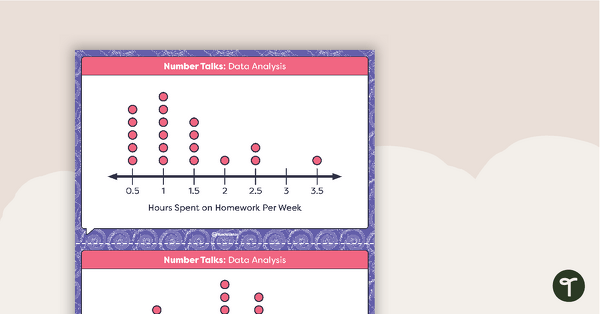
Use data analysis skills to match frequency tables with a corresponding bar graph or pictograph. Use data analysis skills to analyze bar graphs and pictographs with this set of task cards. Use data analysis skills to match tally charts and frequency tables with their corresponding bar graph, pictograph, or dot plot.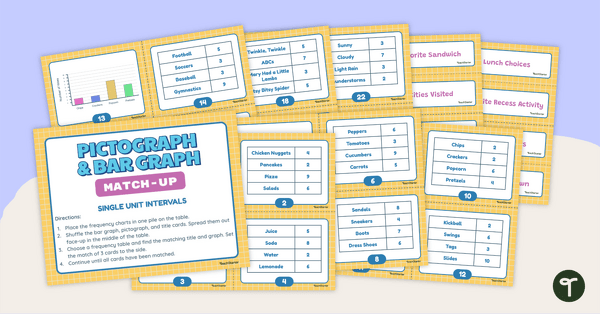
teaching resource
Pictograph and Bar Graph Match-Up (Single-Unit Intervals)
teaching resource
Analyzing Graphs – Single-Unit Bar Graphs & Pictographs – Task Cards
teaching resource
Pictograph, Bar Graph, & Dot Plot Match-Up (Scaled Intervals)


0 Comments
Write a review to help other teachers and parents like yourself. If you'd like to request a change to this resource, or report an error, select the corresponding tab above.