Assign this data collection project to enable students to master the skills of gathering, recording, and graphing data.
Data Collection Classroom Investigation Project
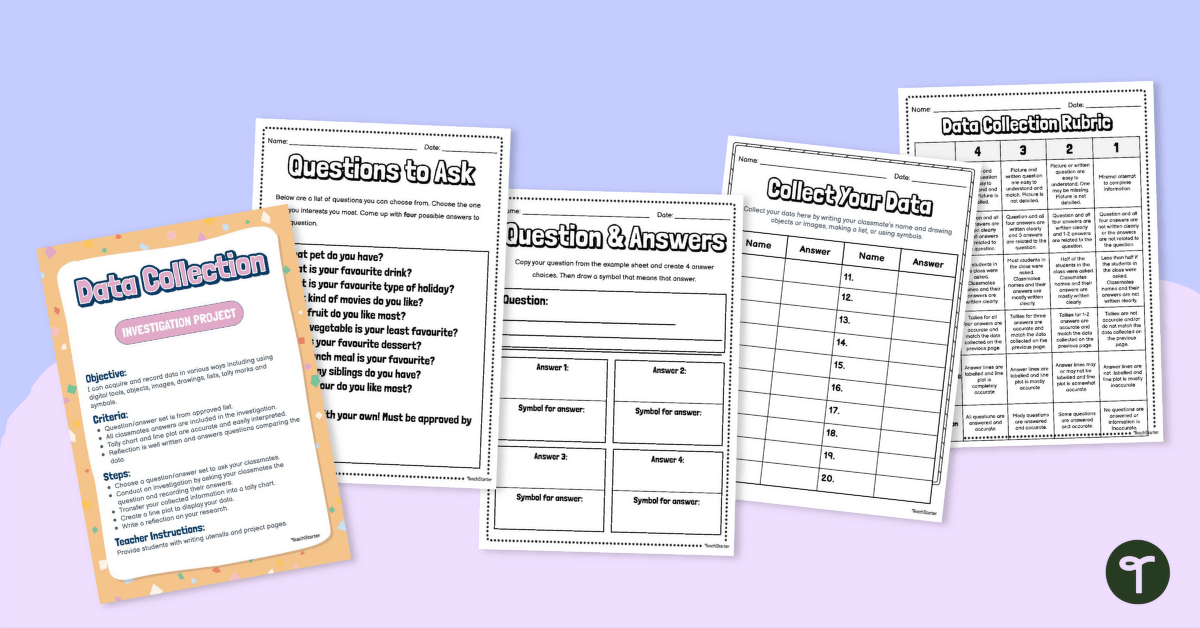
Learning is most effective when it’s interactive and engaging. This investigation project is focused on data collection, and enables students to gather and record data using tally marks and then create a pictograph from the data. With a structured approach and approved questions, students can take their first steps into the exciting world of data analysis.
Foster Comprehensive Data Skills
With this data collection teaching resource, students can master the art of acquiring and recording data through four essential steps:
- Engage: Select a question from the approved list to investigate. This ensures that students delve into meaningful and relevant inquiries.
- Investigate: Encourage students to ask their classmates the selected question, recording their answers meticulously.
- Visualize: Transform the collected data into a tally chart and pictograph, helping students understand and interpret the information effectively.
- Reflect: Promote reflective thinking with well-written reflections that answer questions and draw comparisons within the data.
Teacher Instructions: Simplify Implementation
We’re here to equip educators like you for success! This teacher-designed teaching resource comes with comprehensive teacher instructions to help make the learning process smooth and engaging. Simply provide your students with writing utensils and project pages, and watch them thrive as they explore the world of data collection, graphs and data.
Use the dropdown arrow located on the Download button to choose between the easy-to-print PDF or editable Google Slides version.
This resource was created by Kaylyn Chupp, a teacher in Florida and Teach Starter Collaborator.
Looking for More Great Graphs and Data Resources?
Prepare your students for a future where data literacy is essential. Unlock the potential of data and graphs in the classroom, making learning an interactive and exciting journey.
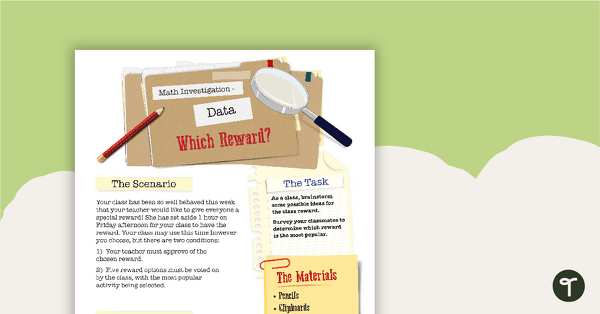
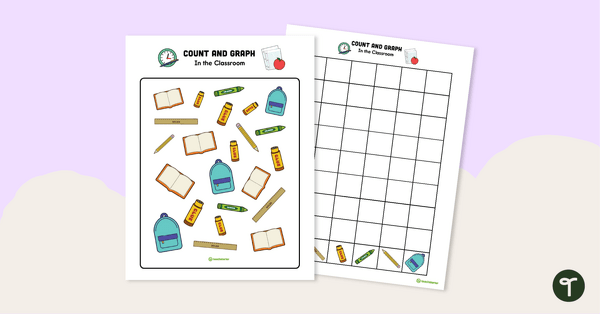
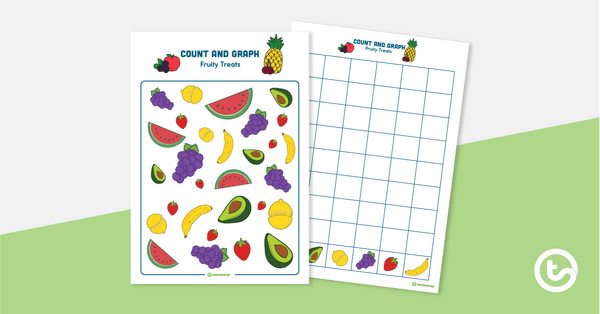
[resource:2652042] [resource:2668294] [resource:4994191]



0 Comments
Write a review to help other teachers and parents like yourself. If you'd like to request a change to this resource, or report an error, select the corresponding tab above.