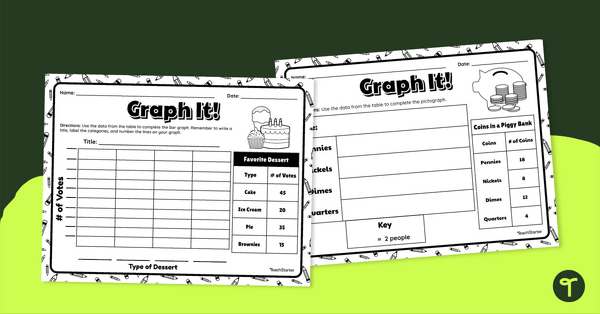
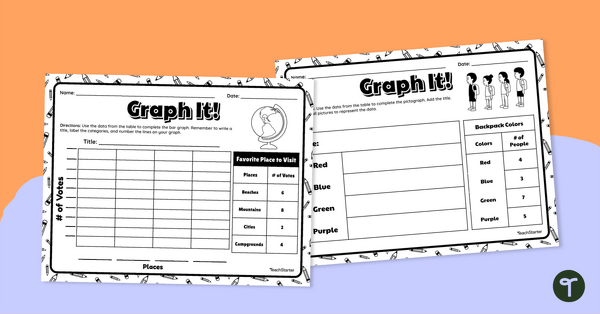
Use this set of differentiated graphs worksheets to assess your students’ understanding of how data is collected, organized and presented.
Collect, Organize and Interpret Data
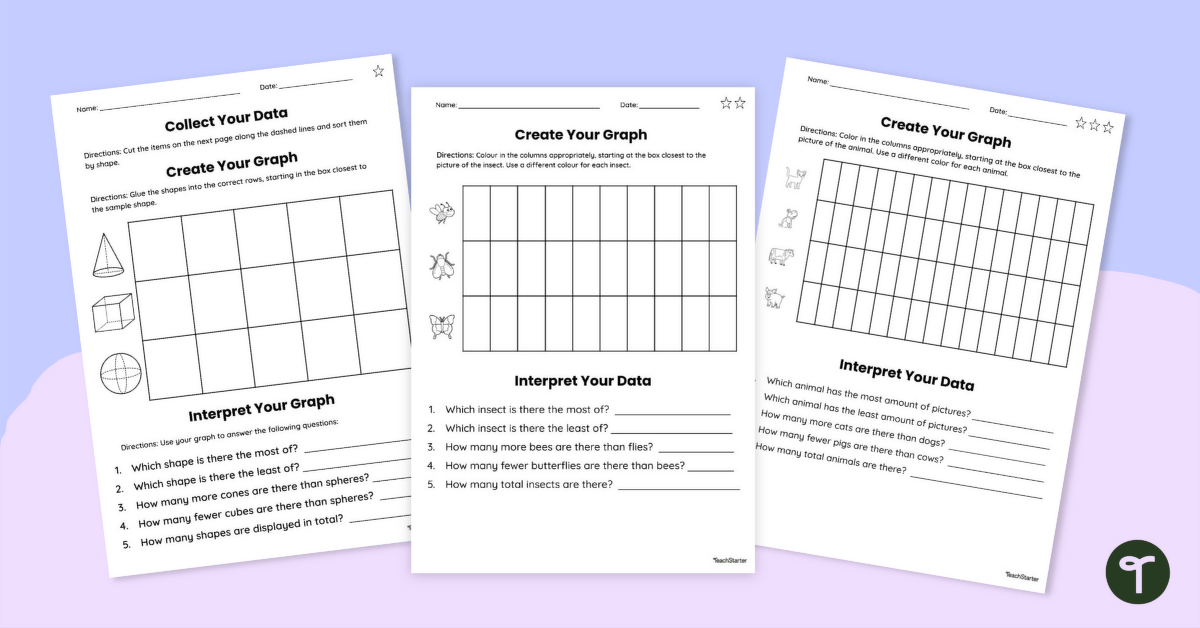
This graphs and data activity set contains three double-sided worksheets, which are leveled for in-class differentiation. Each double-sided worksheet contains the following sections:
- Collect your data
- Organize your data
- Create your graph
- Interpret the data
The first worksheet in the set (identified with one star in the top right corner) is the beginning level of understanding, and the sheets become more difficult through to two- and three-star levels.
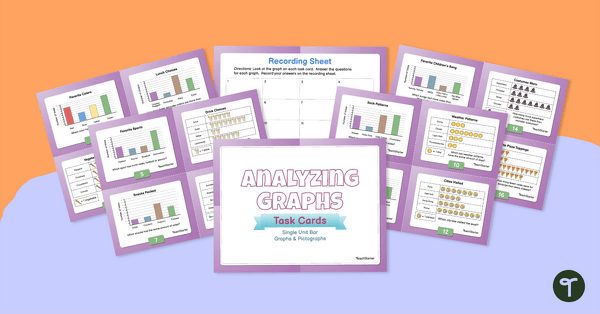
Throughout this activity, students will understand and process data to create simple pictographs, bar graphs and tally charts. Use it as a formative assessment to check in with how your students are going with these concepts.
Using These Graphs and Data Worksheets in Your Classroom
These graphs and data worksheets are versatile and may be used in a variety of ways in the classroom setting.
- Maths groups or rotations
- Small group focus work with a teacher or aide
- Homework task
- Whole class learning
- Projected on your screen and worked through as a modelling exercise.
Download and Go
Use the dropdown menu located on the Download button to choose between the printable PDF or editable Google slides version of the resource.
This resource was created by Kaylyn Chupp, a teacher in Florida and Teach Starter collaborator.
Are You Searching for More Great Graphing Activities?
We have plenty! Take a look at these ones:
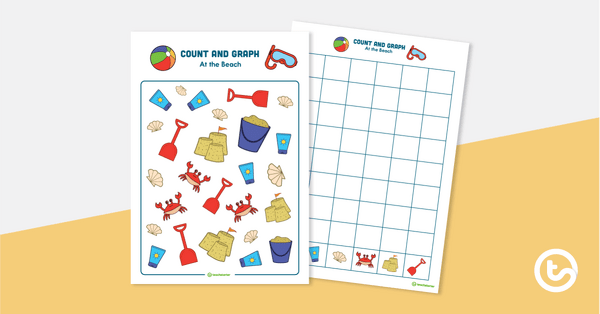
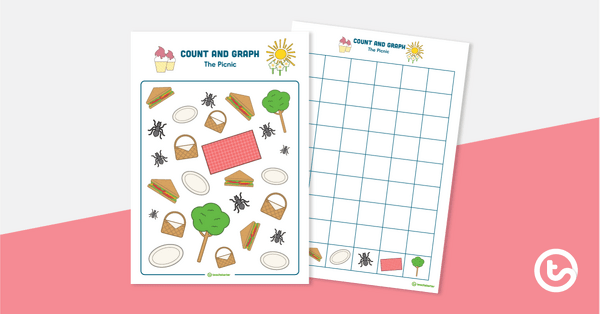
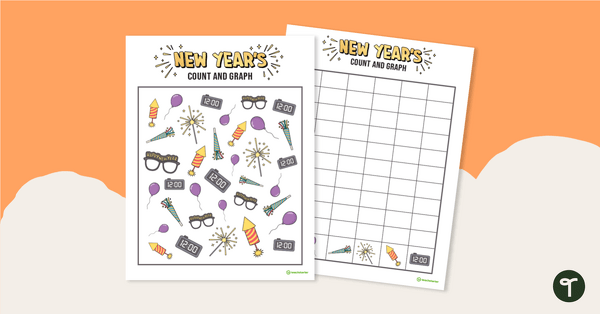
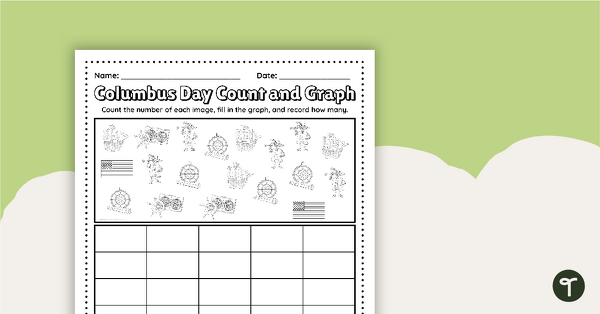
[resource:2652042] [resource:2668294] [resource:4994191]

2 Comments
Write a review to help other teachers and parents like yourself. If you'd like to request a change to this resource, or report an error, select the corresponding tab above.
No comments yet.