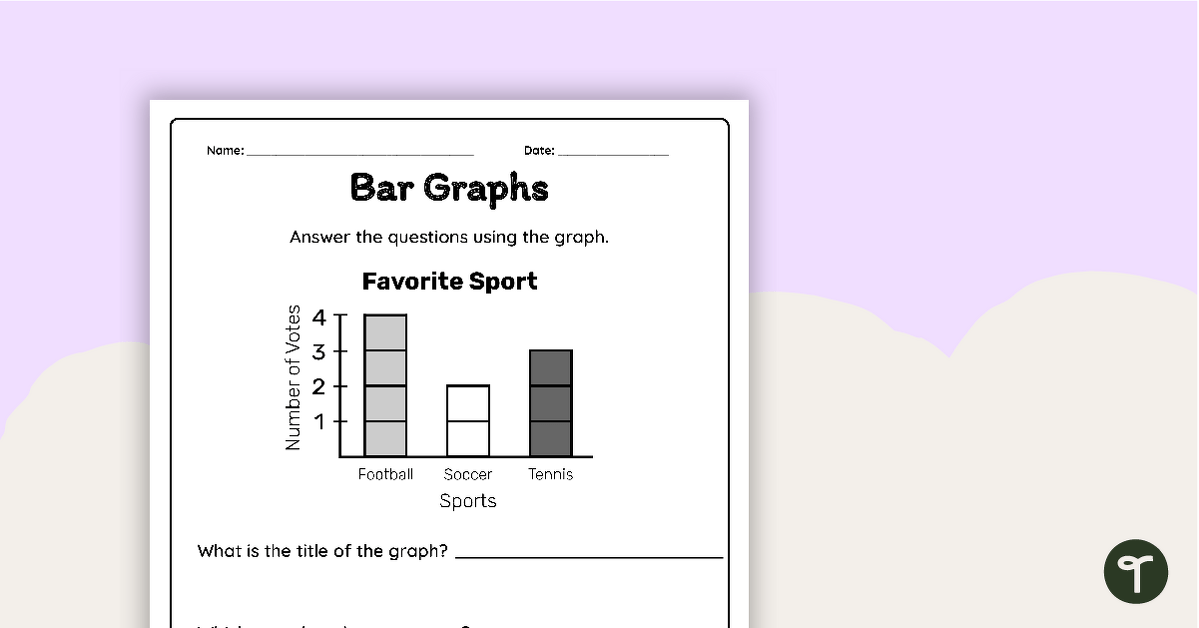
Interpret information from a bar graph and answer questions with this worksheet.
📊 Looking for Bar Graph Worksheets?
With this simple worksheet, students will interpret the data represented in the graph and answer various questions.
Use this as an introduction to bar graphs for your first and second-grade students before having them create their own bar graph data representations.
By completing this worksheet, students will demonstrate their ability to interpret data.
An answer key is included with your download to make grading fast and easy!
Tips for Differentiation + Scaffolding
To make this worksheet more of a challenge for fast finishers, have students conduct their own survey and create their own bar graph on the back of the page.
Students who need extra support can create a 1:1 picture graph version of this bar graph using hands-on manipulatives. This will help with calculating which option had the most and least votes as well as finding the total amount of votes.
🖨️ Easily Download & Print
Use the dropdown icon on the Download button to choose between the PDF or editable Google Slides version of this resource.
Turn this teaching resource into a sustainable activity by printing on cardstock and slipping it into a dry-erase sleeve. Students can record their answers with a whiteboard marker, then erase and reuse them.
Additionally, project the worksheet onto a screen and work through it as a class by having students record their answers in their notebooks.
Get more handy worksheets here!
This resource was created by Kendall Britnell, a teacher in Colorado and Teach Starter Collaborator.
Don’t stop there! We’ve got more activities to shorten your lesson planning time:
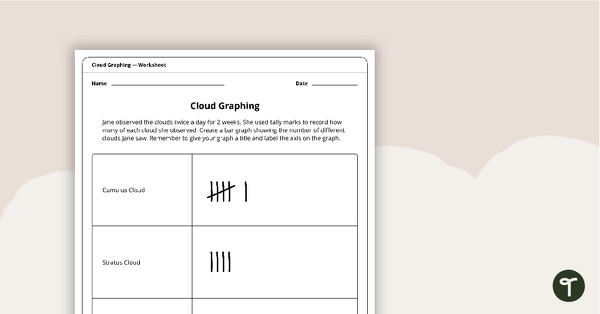
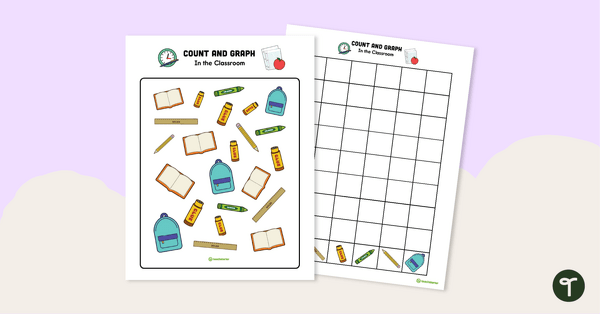
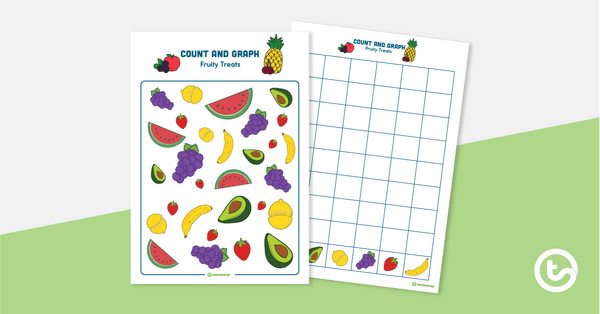
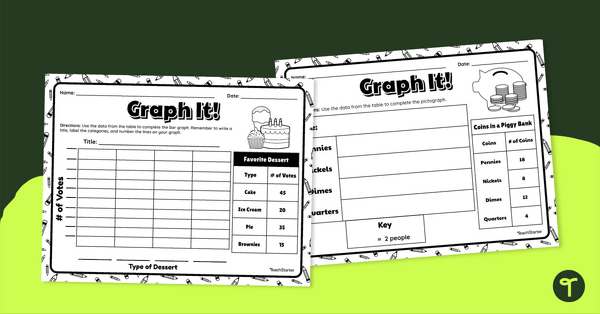
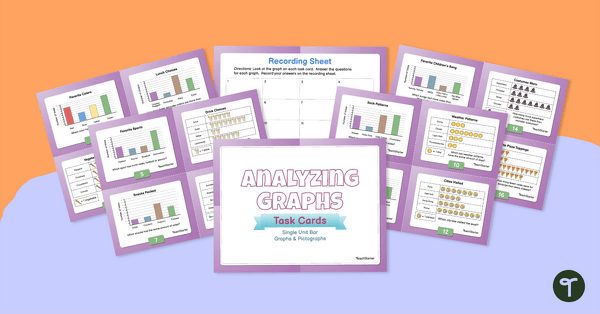
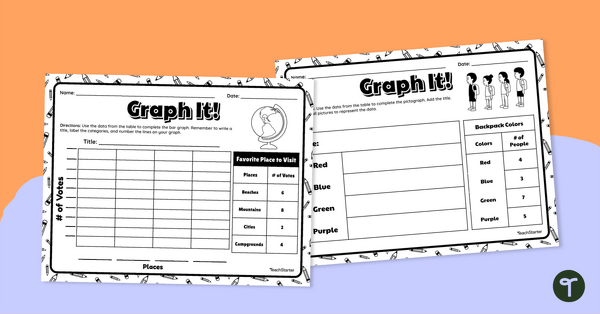
[resource:4849589] [resource:4840933] [resource:4840796]

0 Comments
Write a review to help other teachers and parents like yourself. If you'd like to request a change to this resource, or report an error, select the corresponding tab above.