Download a Range, Mean, Median & Mode Chart pack to help your students remember measures of central tendency.
Looking for a Range, Mean, Median, Mode Chart?
Tired of students mixing up these important data terms? If you’re looking for a range, mean, median, mode chart that’s clear, colorful, and classroom-ready—you’ve found it! Whether you’re introducing these math concepts or reviewing them during a data unit, this printable anchor chart will give your students the visual support they need to confidently interpret and analyze data. If you’re looking for a range, mean, median, mode chart that’s both effective and easy to use, you’ve found the perfect tool!
Printable Mean, Median, Mode, & Range Anchor Chart Pack
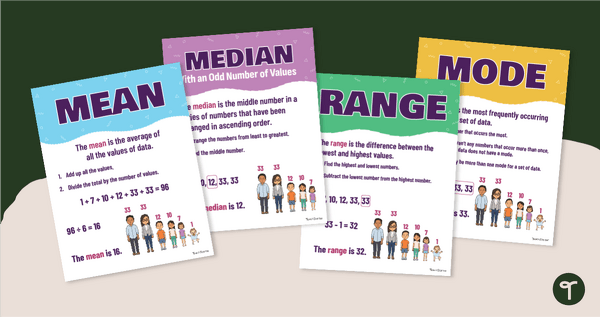
This Printable Mean, Median, Mode & Range Anchor Chart Pack includes 5 printable Mean, Median, Mode & Range anchor charts featuring vibrant visuals and kid-friendly definitions for each term. It features examples and step-by-step explanations to help students understand how to calculate and differentiate between each measure of central tendency. Perfect for math walls, reference folders, or student notebooks, this Meaen Median, Mode & Range Anchor chart set supports long-term retention and builds math vocabulary.
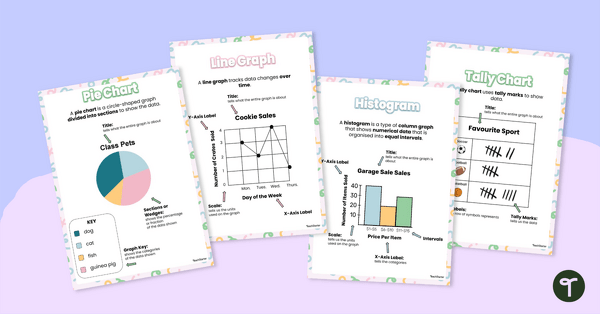
The following posters are included in your download:
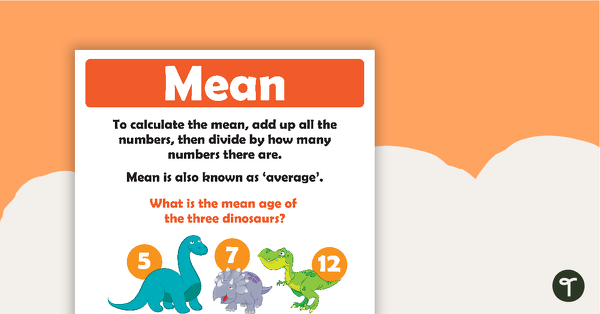
- Mean
- Median (With an even number of data points)
- Median (With an odd number of data points)
- Mode
- Range
Download Your Chart! Mean, Median, Mode, & Range Made Easy!
Ready to grab your chart? Mean, Median, Mode, & Range are at your fingertips with this easy-to-use resource. It is available as an easy-to-edit Google Slides file or Printable PDF Resource file. To get your copy, click the dropdown arrow on the download button to select the file format you prefer.
This resource was created by Brittany Collins, a teacher in Indiana and Teach Starter collaborator.
Resources to Pair With Your Mean Median Mode Chart
Before you go, don’t miss out on a world of educational resources to pair with your Mean, Median, Mode Chart! Explore these related resources to enhance your teaching toolkit.
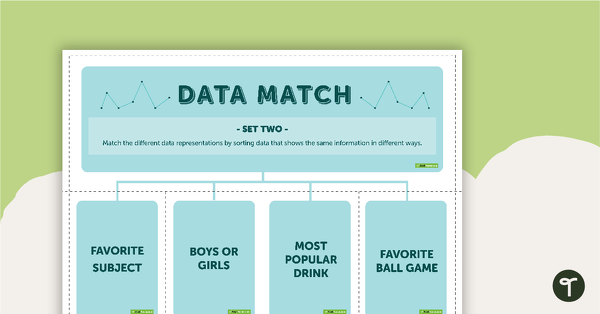
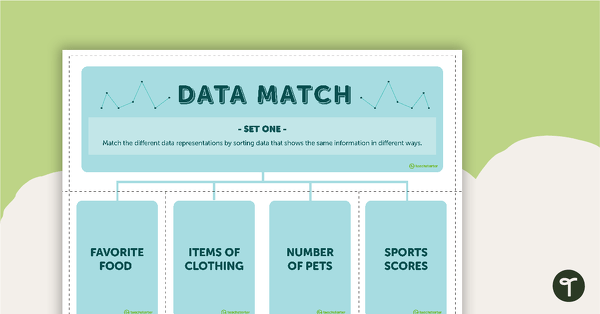
[resource:4998401] [resource:4996204]

0 Comments
Write a review to help other teachers and parents like yourself. If you'd like to request a change to this resource, or report an error, select the corresponding tab above.