Hang this bar graph anchor chart in your classroom to teach your students about the different parts of this commonly used graph.
A Bar Graph Anchor Chart in Many Colors
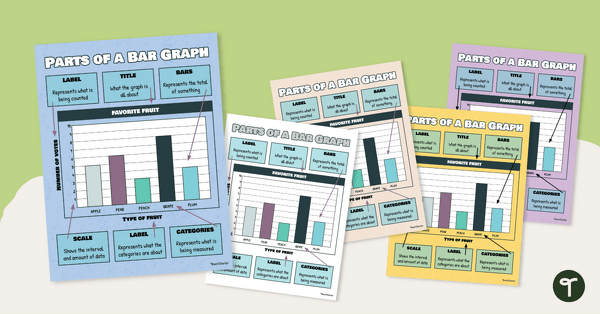
Help your students master the parts of a graph with this vibrant, easy-to-understand bar graph anchor chart! Perfect for classroom walls, this resource clearly labels all key parts of a graph, making it an essential reference tool for any math classroom. Available in five eye-catching colors to match your classroom theme, this digital download is ready to print and use right away.
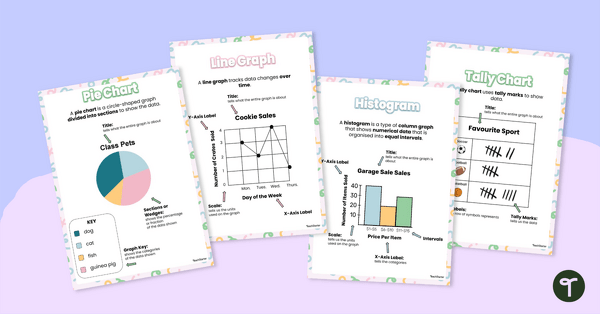
The features labeled on this bar graph anchor chart include:
- Title
- Label
- Columns / Bars
- Scale
- Categories
This bar graph anchor chart is available as a PDF or an editable Google Slides version, so you can customize the provided graph as you like.
Using Our Bar Graph Poster
This resource is a one-page poster, but it can be used in many ways! Here are some ideas on using this bar graph poster in the classroom.
Interactive Introduction: Use the poster as a guide while introducing column / bar graphs. Have students identify each part of the graph on your poster before applying it to real-world data.
Graphing Scavenger Hunt: Use the editable features of the Google Slides version to provide students with a graph with blank labels. Then have them label the parts using the terms from the poster. This makes a great review activity!
Partner Check: Encourage peer teaching by having students use the poster as a checklist to evaluate each other’s graphs for accuracy and completeness.
Download This Parts of a Bar Graph Anchor Chart
This parts of a bar graph anchor chart is available in both easy-to-print PDF and Google Slides formats. Click the drop-down arrow located on the download button to choose the option that suits your classroom.
This resource was created by Kaylyn Chupp, a teacher in Florida and Teach Starter collaborator.
Want More Like Our Parts of a Graph Anchor Chart?
If you are looking for more resources related to this parts of a graph anchor chart, you’re in the right spot! Take a look at additional offerings below.
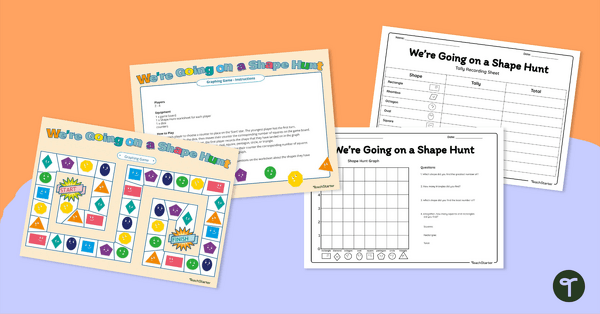
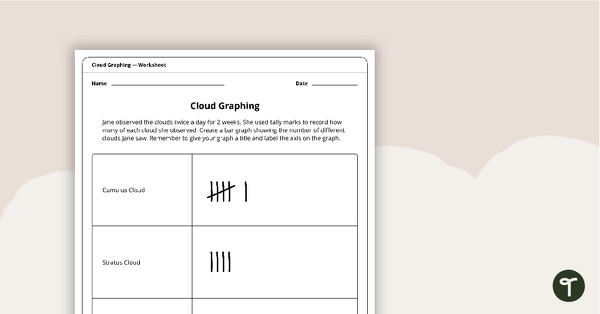
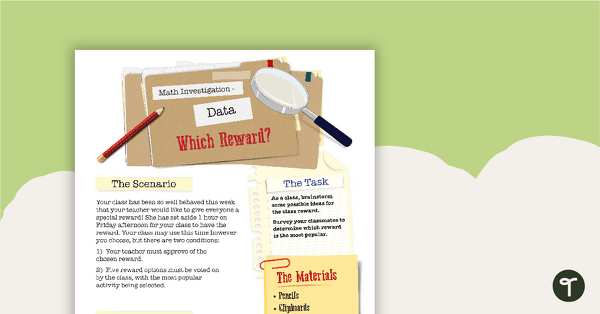
[resource:4842744] [resource:5016363] [resource:4849589]

0 Comments
Write a review to help other teachers and parents like yourself. If you'd like to request a change to this resource, or report an error, select the corresponding tab above.