Math 3.8(B)
solve one- and two-step problems using categorical data represented with a frequency table, dot plot, pictograph, or bar graph with scaled intervals.
- Plus Plan
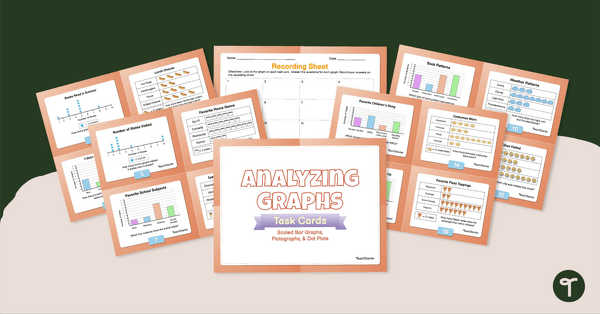
Analyzing Graphs — Scaled Bar Graphs, Pictographs, & Dot Plots —Task Cards
Use data analysis skills to analyze scaled bar graphs, pictographs, and dot plots with this set of task cards.
- Plus Plan
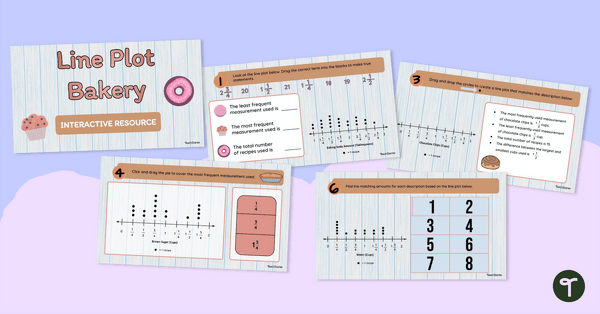
Dot Plot Bakery Interactive Activity
Strengthen dot plot skills with this bakery-themed interactive activity, designed to help students practice creating and analyzing dot graphs in a fun, structured way.
- Plus Plan
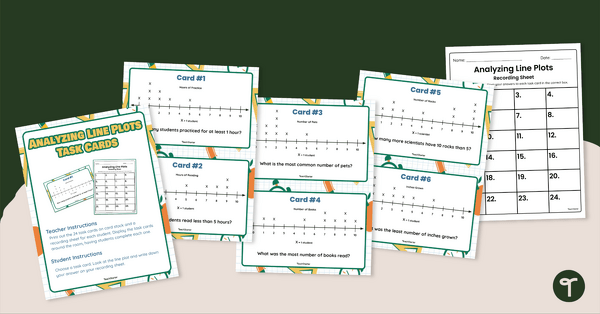
Analyzing Dot Plots Task Cards
Strengthen data analysis skills by interpreting dot plots with this set of 24 task cards.
- Plus Plan
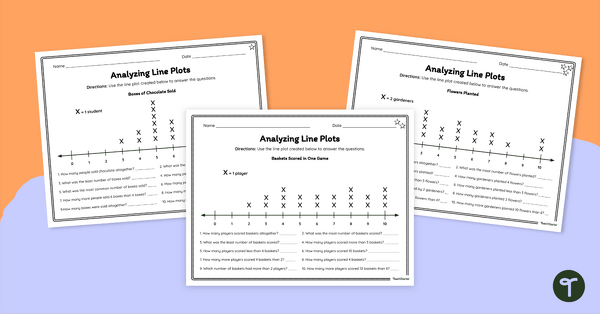
Analyzing Line Plots – Differentiated Worksheets
Empower your students to become proficient data interpreters with this set of differentiated line plot worksheets.
- Plus Plan
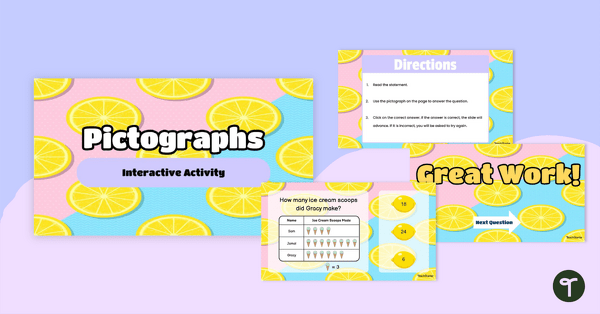
Pictographs - Interactive Activity
Use this fun and engaging interactive activity to aid students. in practicing their pictograph interpretation skills.
- Plus Plan
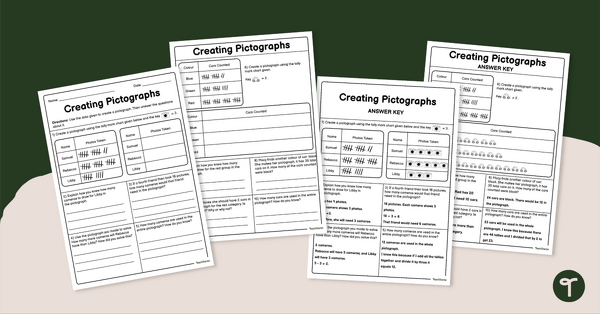
Creating Pictographs Worksheet
Use this engaging worksheet to practice creating and reading pictographs.
- Plus Plan
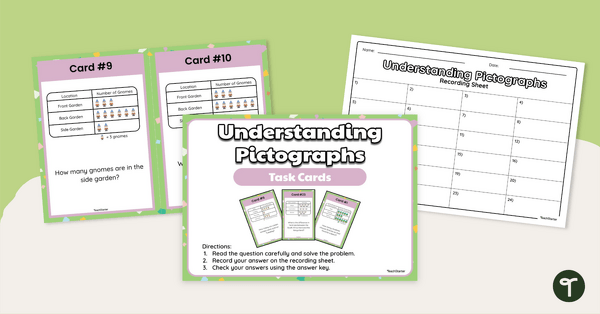
Understanding Pictographs - Task Cards
Use this set of task cards to practice reading and interpreting pictographs and bar graphs.
- Plus Plan
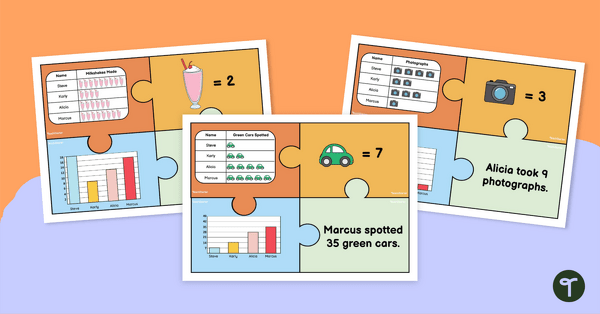
Pictograph Puzzles
Practice reading and interpreting pictographs with these fun puzzles which require students to match pictographs with other data displays with matching data.
- Plus Plan
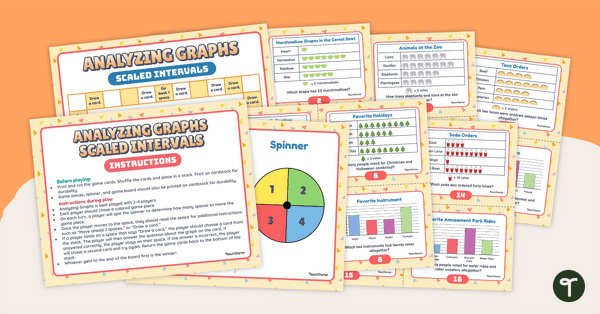
Analyzing Graphs (Scaled Intervals) – Board Game
Use this board game to sharpen data analysis skills when solving problems with information presented in a scaled picture graph and bar graph.
- Plus Plan
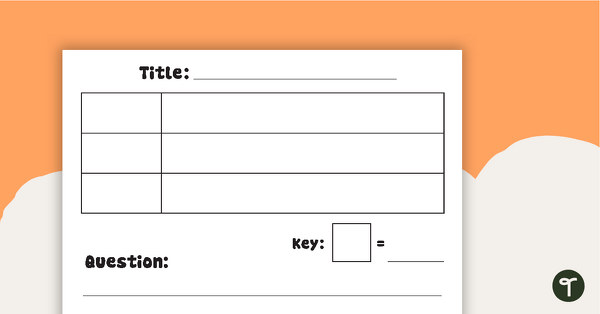
Picture Graph Templates
A set of blank picture graph templates for students to represent data.