Australian Curriculum V8
ACMSP147
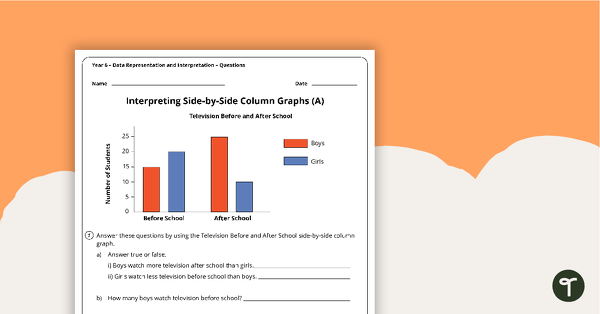
Interpret and compare a range of data displays, including side-by-side column graphs for two categorical variables
Show more
5
teaching resources for those 'aha' moments
- Free Plan

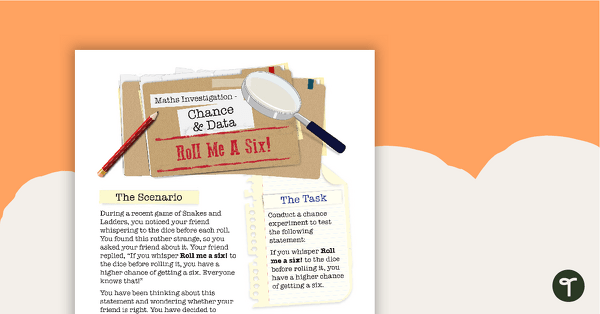
Chance and Data Maths Investigation - Roll Me a Six!
A mathematics investigation involving chance and data, embedded in a real-world context.
- Plus Plan

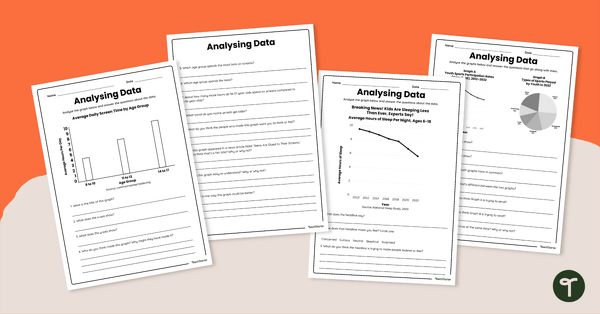
Analysing Data Worksheet Set
Share this analysing data worksheet set with your students to give them varied practice interpreting multiple data representations.
- Plus Plan

Maths Warm Ups PowerPoint - Year 6
A PowerPoint providing a series of warm up activities for Year 6 students across the curriculum.
- Plus Plan

Data Representation and Interpretation Worksheets - Year 6
8 data representation and interpretation worksheets linked to the Australian Curriculum.
- Plus Plan

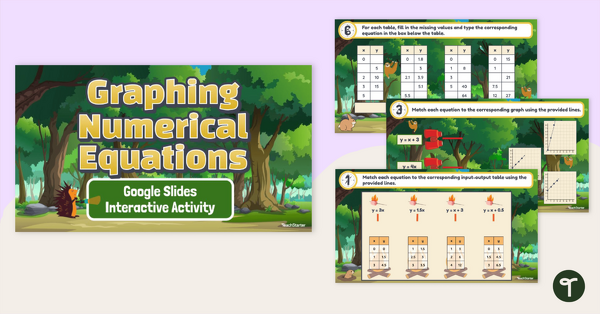
Graphing Numerical Equations – Google Slides Interactive Activity
Recognise and analyse patterns in graphs, input-output tables and equations with this interactive activity.