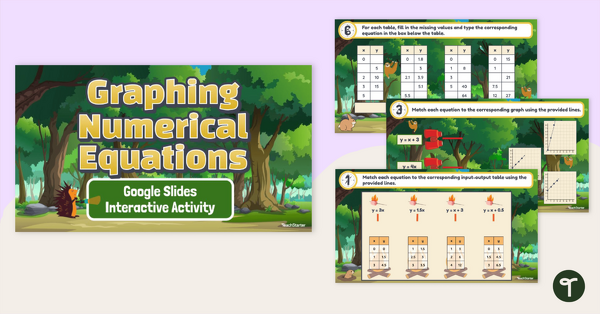
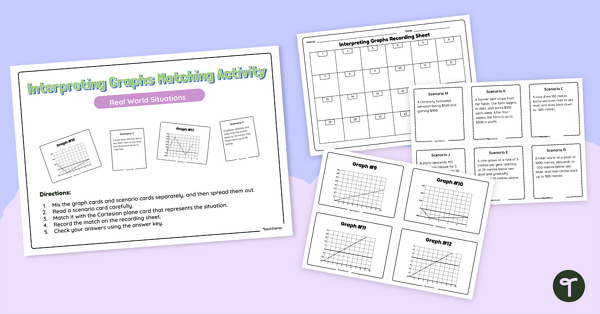
Recognise and analyse patterns in graphs, input-output tables and equations with this interactive activity.
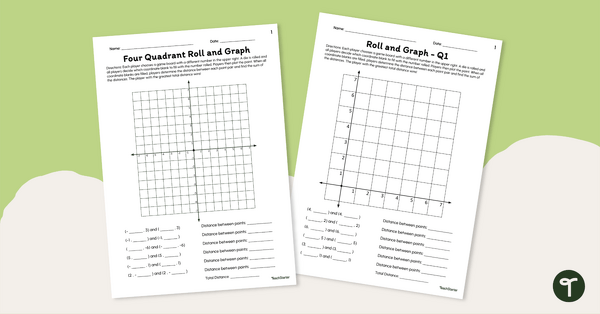
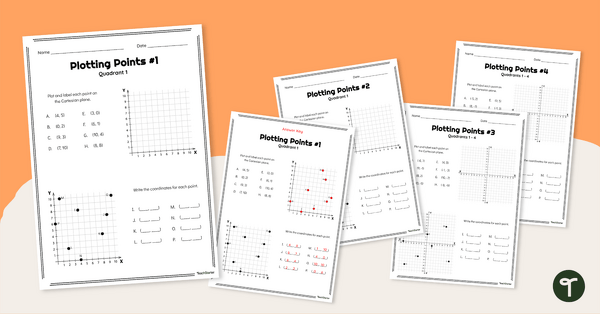
Practise Plotting Ordered Pairs to Create a Graph
Are your students learning about numerical patterns and equations? A numerical pattern is a sequence of numbers that follows a specific rule or set of rules. The rule or rules can be simple, such as increasing by a certain amount each time, or more complex, involving multiple operations.
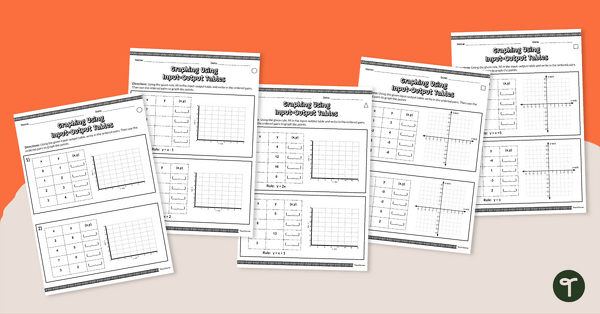
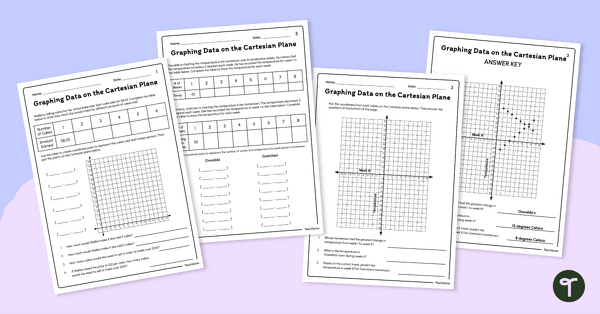
Once students learn how to extend number patterns in an input-output table, they may be ready to graph these points. This is done by moving along the x and y-axis for each value within the ordered pair.
Additionally, your grade 5 students may be learning how to graph simple equations such as y = x + 0.5 or y = 3x. To create a graph from an equation such as this, input a value for x and calculate the answer to determine y. This process can be repeated several times until you have a set of ordered pairs to plot on a coordinate grid.
If you are in need of a fun and interactive activity for your students to practise these skills, have no fear! Teach Starter has put together a collection of activities for your students to practise this important maths skill.
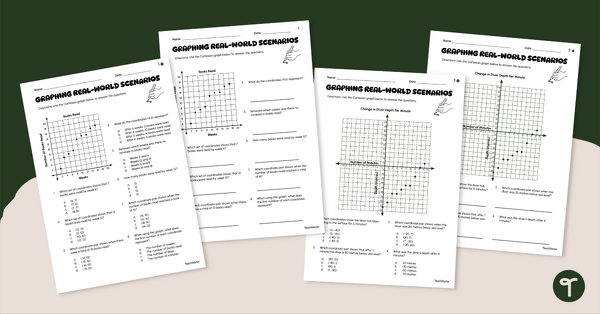
The goal of this activity is to practice recognising and analysing patterns in graphs, input-output tables and equations.
Tips for Differentiation + Scaffolding
A team of dedicated, experienced educators created this resource to support your statistics lessons.
In addition to individual student work time, use this activity to enhance learning through guided maths groups, whole class lessons, or remote learning assignments.
If you have a mixture of above and below-level learners, we have a few suggestions for keeping students on track with these concepts:
🆘 Support Struggling Students
For students who need additional support, allow for the use of completed examples and notes. Students can work one-on-one with the teacher or with a peer tutor.
➕ Challenge Fast Finishers
The slides can be edited to include more complex equations and numbers (such as fraction or decimal amounts). Encourage students needing a challenge to create a memory match game of equations and tables, or give them 2-step equations to make tables and graphs for such as y=2x+5.
🧑🏫 Group Learning
Project the slides onto a screen and work through them as a class by having students record their answers in their notebooks or mini whiteboards.
Easily Prepare This Resource for Your Students
Use the Download button to select either the interactive Google Slides or Powerpoint version of this resource. An answer key is also included for easy grading!
Assign this interactive activity in Google Classroom. Please be sure to open in Edit mode, not Presentation mode. Students will drag and drop, use the paint bucket tool, and type in responses to complete the activities.
This resource was created by Lorin Davies, a teacher and Teach Starter Collaborator.
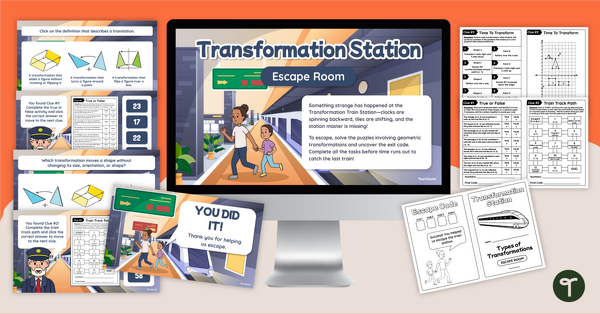
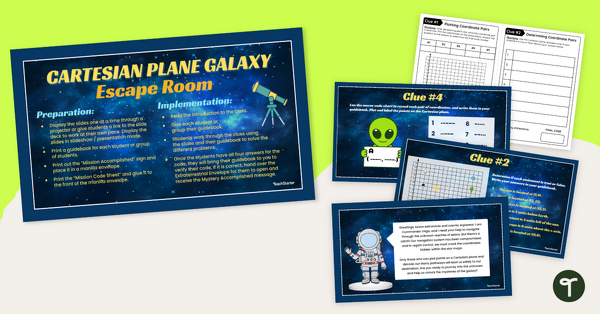
While you’re here, check out more activities and teaching resources that fill your lesson plans and students’ brains:
[resource:57558] [resource:4963963] [resource:3035802]


0 Comments
Write a review to help other teachers and parents like yourself. If you'd like to request a change to this resource, or report an error, select the corresponding tab above.