Introduce these graphing data worksheets to your students to give them practise graphing real-world situations on the Cartesian plane.
Graphing Data Worksheets for the Cartesian Plane
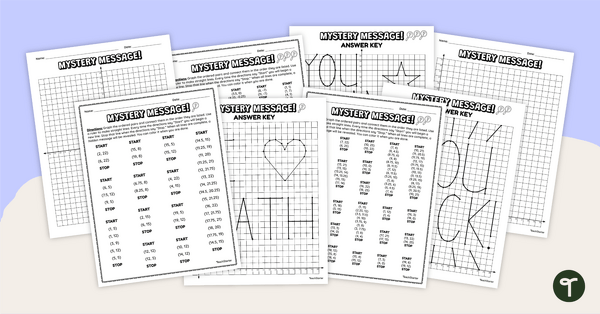
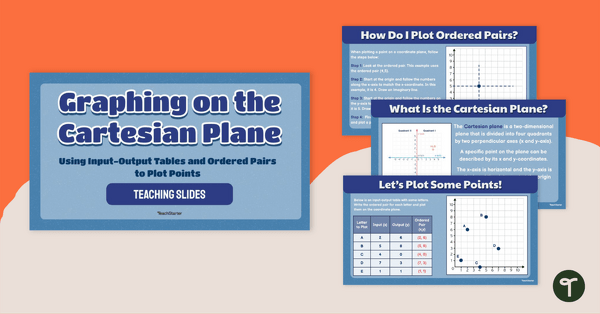
These differentiated graphing data worksheets are a great way to enhance a Cartesian plane or data unit. In these multi-skill worksheets, students will encounter data from real-world situations, helping to make maths relevant to their lives.
Skills in these graphing data worksheets include:
- Extending and extrapolating data
- Completing input-output tables
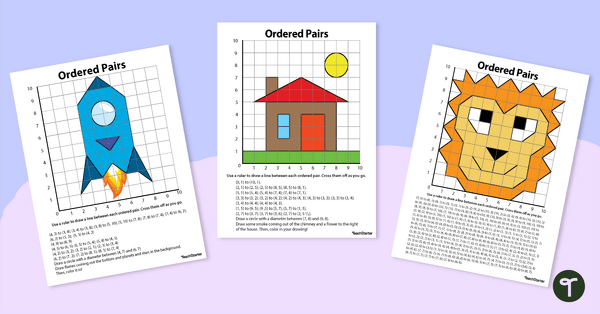
- Plotting points in a one-quadrant Cartesian plane
- Plotting points in a four-quadrant Cartesian plane
- Analysing data
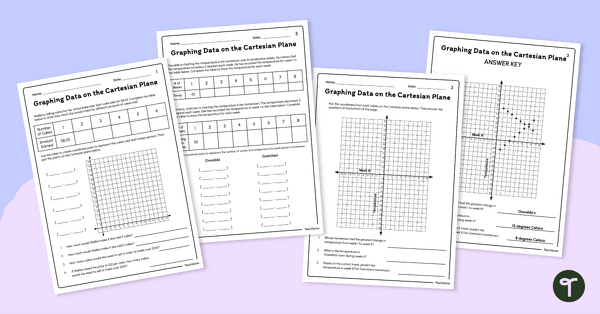
Four worksheets with answer keys are included. All worksheets require students to fill in a table of data that follows a pattern and answer questions about the data. Two worksheets ask students to plot points in the first quadrant and the other two in all four quadrants, so you can choose which version works best for your students.
Graphing From a Table of Real-World Data
If your students have mastered plotting points on the Cartesian plane, it’s definitely time to take them to the next level and have them begin graphing from a table of real-world data. Why? We’re glad you asked!
- Relevance: Connecting maths to real-world scenarios increases student engagement by showing the practical applications of what they’re learning.
- Data Literacy: In a data-driven world, students who learn to interpret and analyse real-world data are developing essential skills for life and many professional fields.
- Critical Thinking Skills: Having students analyse real-world data in tables and graphs encourages them to think critically about the information, draw conclusions, and make informed decisions about what they see.
- Interdisciplinary Learning: Tables, data, and graphs aren’t just for maths class! You can easily use these graphing data worksheets to integrate concepts from science, social studies and other subjects, promoting a holistic learning approach.
Download This Graphing From a Table of Values Worksheet Set Today
This differentiated graphing from a table of values worksheet set is available in both easy-to-print PDF and Google Slides format. Click the drop-down arrow located on the download button to choose the option that suits your classroom.
This resource was created by Brittany Collins, a teacher and a Teach Starter collaborator.
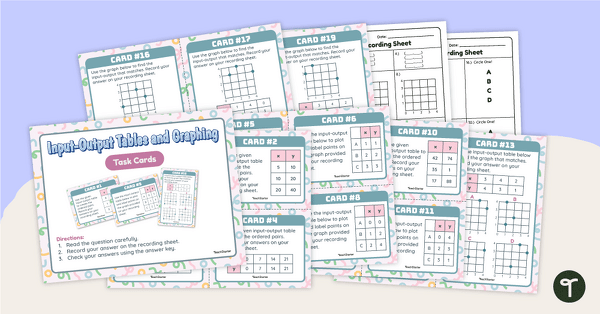
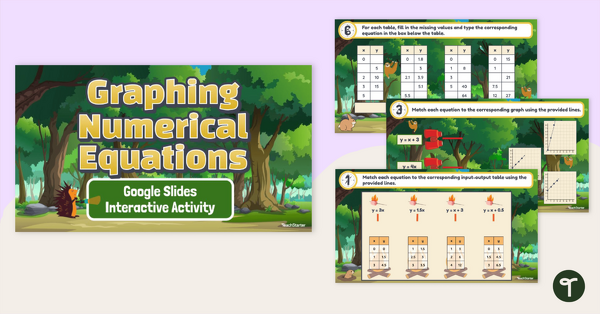
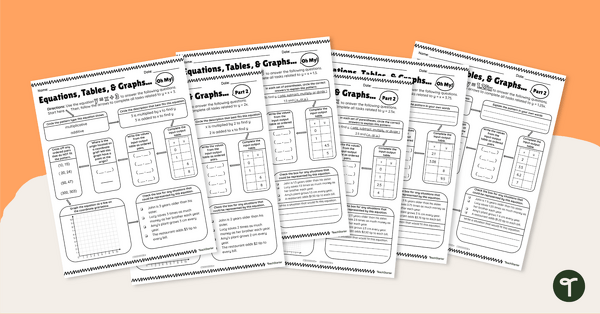
Dive Deeper With Input and Output Tables Worksheets
Looking for some input and output tables worksheets or activities to round out your data unit? Look no further! Check out some of our favourites below.
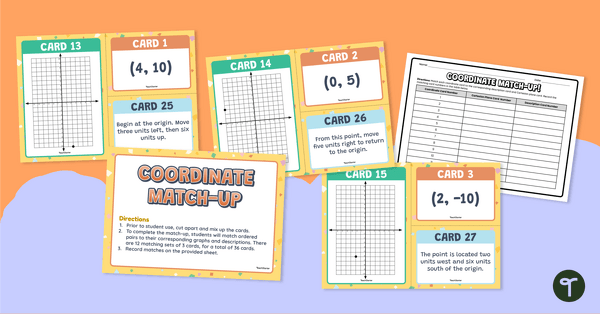
[resource:4963963] [resource:4968064] [resource:4965972]

0 Comments
Write a review to help other teachers and parents like yourself. If you'd like to request a change to this resource, or report an error, select the corresponding tab above.