Incorporate this interpreting graphs matching activity into your unit on Cartesian planes.
Interpreting Graphs for Real World Situations
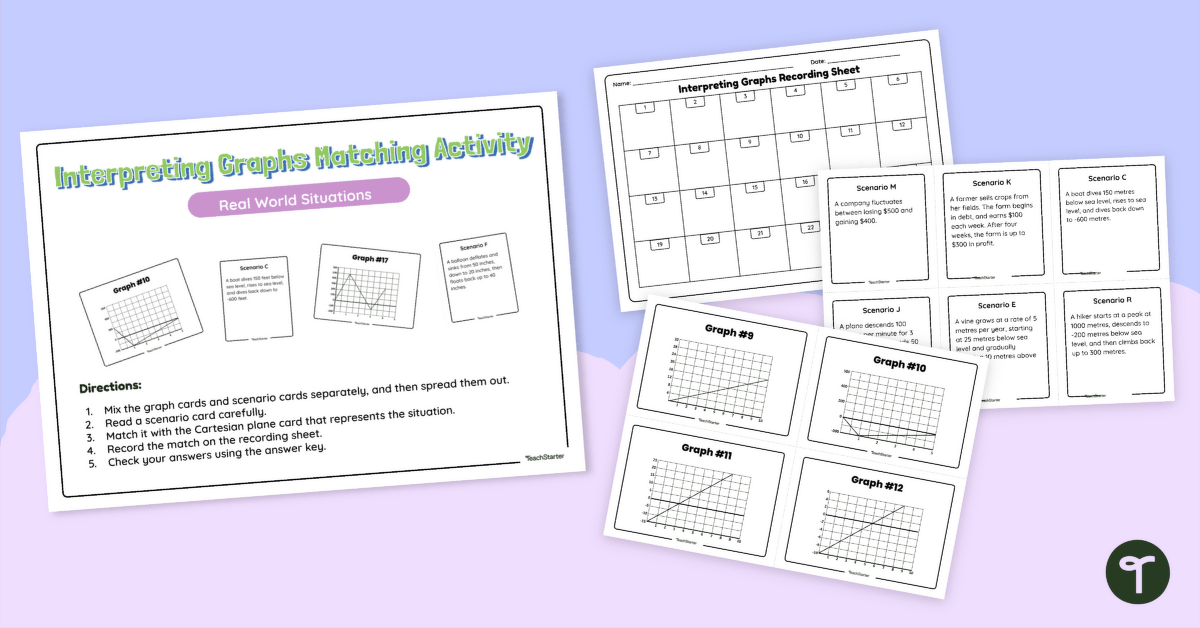
This interpreting graphs activity will have your students matching real-world scenarios with their representations on the Cartesian plane. Students will encounter situations displayed in both the first and fourth quadrants.
Included in this resource:
- 24 graph cards
- 24 scenario cards
- Recording sheet
- Answer key
- Instructions
This interpreting graphs activity really shines in stations or in guided group learning situations. You can easily vary the difficulty by providing more or less graph/scenario pairs for students to match.
Interpreting Graphs is a Life-Long Skill
Understanding how to interpret data shown on the Cartesian plane and other graphs is not only a skill students will need to meet curriculum requirements, but it also has many real-world applications.
Some of these include:
- Weather Tracking: Weather can profoundly affect our daily lives, so the ability to interpret meteorological data is important.
- Sport Statistics: Many adults enjoy following a particular sport or a favourite team, and understanding the data provided in broadcasts and blogs can enhance involvement and enjoyment in the sport.
- Sales Figures: Many jobs require interpreting marketing and sales data displayed in various forms.
- Scientific Experiments: Scientists often graph results from experiments to analyse and draw conclusions from their data.
- News Reporting: Information about current events is often conveyed through graphs and statistics, so keeping informed requires some Cartesian plane know-how.
Ready in Minutes!
You can choose to download this interpreting graphs activity in either PDF or Google Slides format. Click the drop-down arrow located on the download button to choose the option best works for you.
This resource was created by Kaylyn Chupp, a teacher and a Teach Starter collaborator.
Eager for More?
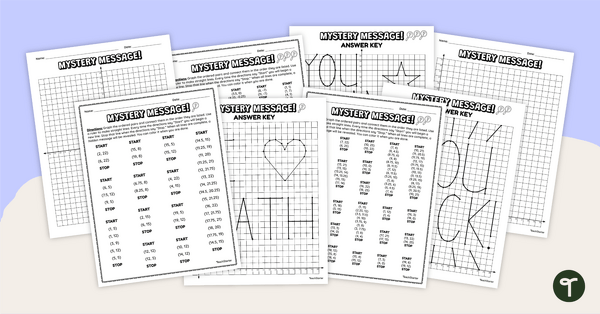
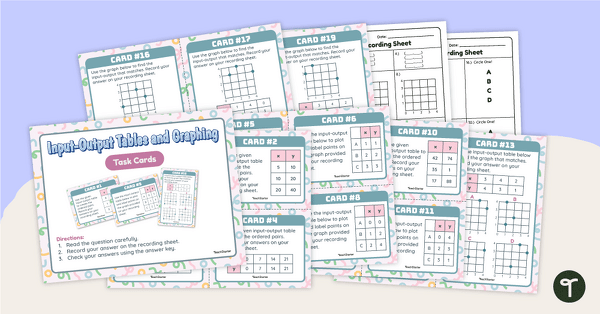
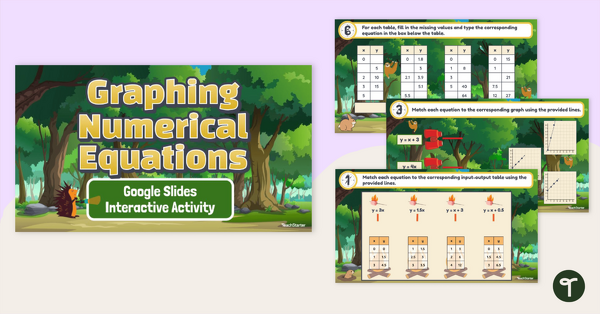
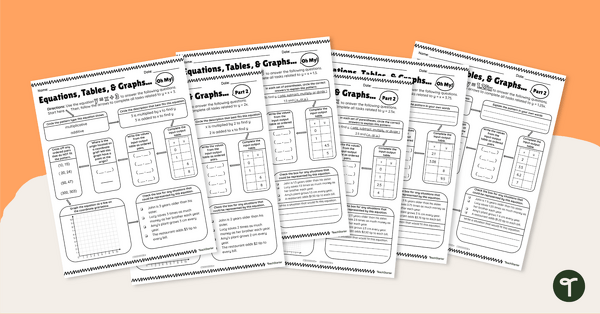
On the hunt for additional resources for your graphing or Cartesian plane unit? We’re happy to help! Here are some other activities your students may enjoy:
[resource:5212] [resource:5114583] [resource:4963963]

0 Comments
Write a review to help other teachers and parents like yourself. If you'd like to request a change to this resource, or report an error, select the corresponding tab above.