Pictographs Teaching Resources
Introduce pictographs in your classroom with printable worksheets, matching activities and more for teaching this math concept in the elementary classroom.
Explore editable resources you can easily differentiate for individual learners, plus math center activities and engaging games to help students understand how to organize and interpret data.
This collection of Common Core curriculum-aligned printable and digital resources has been created just for teachers by the teachers on the Teach Starter team. That means each resource has undergone an in-depth review before publication to ensure it's ready for the classroom and your students!
New to teaching this section of the math curriculum? Read on for a guide to pictographs from our teacher team!
What Are Pictographs? A Kid-Friendly Definition
Let's start with a definition of pictographs that you can share with your students!
A pictograph is like a chart showing information using pictures instead of numbers. Each picture or symbol stands for something. You can use pictographs to understand numbers and data!
Here are some more key terms that your class will encounter as they launch into the world of pictographs!
Picture or Symbol
These are the visuals that represent the data being shown. For example, a picture of a pencil might represent the number of pencils a teacher has in a cup on their desk.
Key
There are plenty of meanings for the word key, but just one for this math tool! In the context of graphing, a key is a legend or a list that explains what each picture or symbol represents. For example, if a pictograph was created to represent the number of school supplies owned by different students, the key might list a pencil symbol as representing one pencil, and a crayon symbol as representing a crayon.
Scale
Like the word key, there are a host of meanings for scale, but in terms of using these graphs in elementary school, scale refers to the increments on the pictograph's axis. For example, a scale of 1 might represent one apple sold, while a scale of 5 might represent five apples sold.
Pictograph Examples
Here are a few common examples of pictographs that can help students get comfortable with using graphs to organize data!
Weather Pictographs
Tying into your science lessons, weather picotgraphs show different types of weather conditions, such as sun, rain, cloud or snowflakes. Budding scientists can use these to track the weather over time or to compare weather in different locations.
Sports Pictographs
Track the most popular sport among students in the classroom with a sports pictograph! These show different types of sports equipment or actions, such as a soccer ball or a running person.
Food Pictographs
Talking about healthy eating or comparing students' favorite foods? Food pictographs are perfect for showing different types of foods or food groups, such as a picture of an apple for fruit or a picture of a hamburger for fast food.
Animal Pictographs
Are you talking about different types of animals or animal characteristics? Use an animal graph with a picture of a lion for "big cat," or a picture of a snake for "slithery animal."
Transportation Pictographs
How do different students in your class get to school? Organize the data with a transportation graph that shows different types of vehicles or modes of transportation, such as a picture of a car, bus, bike or a person walking!
- Plus Plan
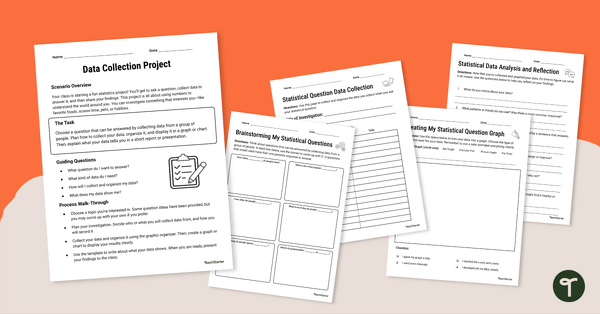
Data Collection Project
Complete this data collection project with your students to give them practice developing a statistical question, collecting data, and displaying the results.
- Plus Plan
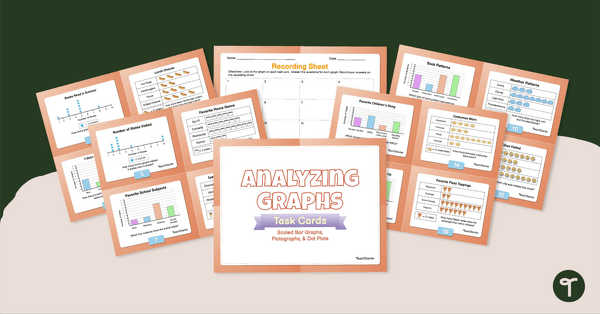
Analyzing Graphs — Scaled Bar Graphs, Pictographs, & Dot Plots —Task Cards
Use data analysis skills to analyze scaled bar graphs, pictographs, and dot plots with this set of task cards.
- Plus Plan
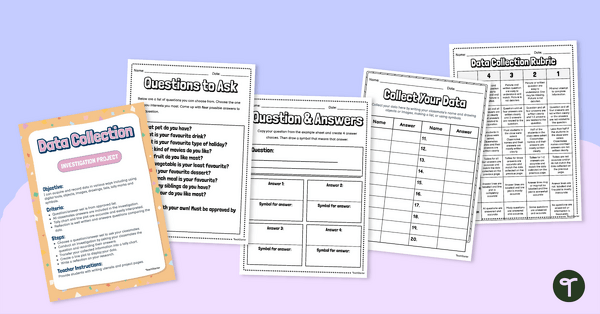
Data Collection Investigation Project
Assign this data collection project to enable students to master the skills of gathering, recording, and graphing data.
- Plus Plan
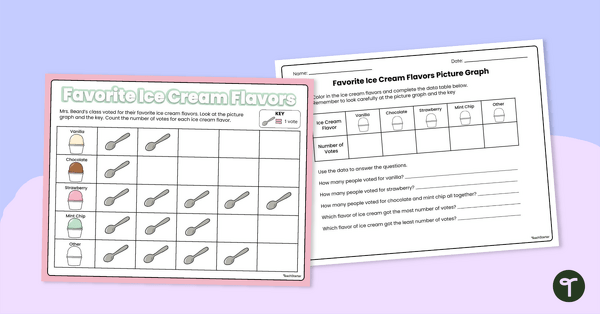
Picture Graphs - Worksheet
Use this double-sided worksheet to help your students practice reading and evaluating a simple picture graph.
- Plus Plan
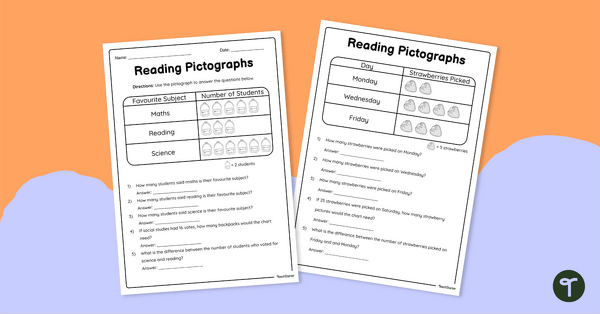
Reading Pictographs - Worksheets
Use this double-sided worksheet to enable students to practice reading and interpreting pictographs.
- Plus Plan
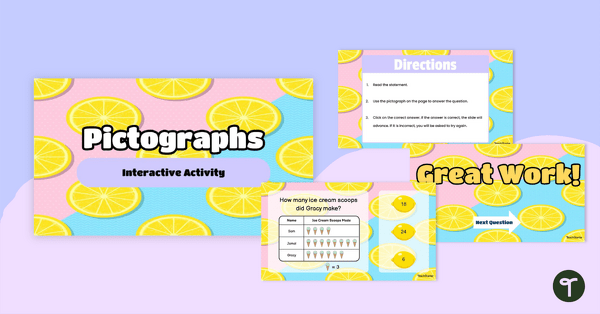
Pictographs - Interactive Activity
Use this fun and engaging interactive activity to aid students. in practicing their pictograph interpretation skills.
- Plus Plan
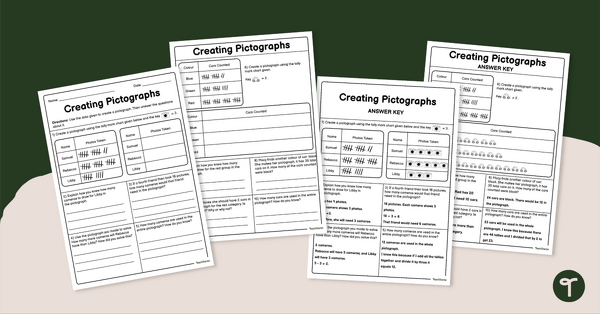
Creating Pictographs Worksheet
Use this engaging worksheet to practice creating and reading pictographs.
- Plus Plan
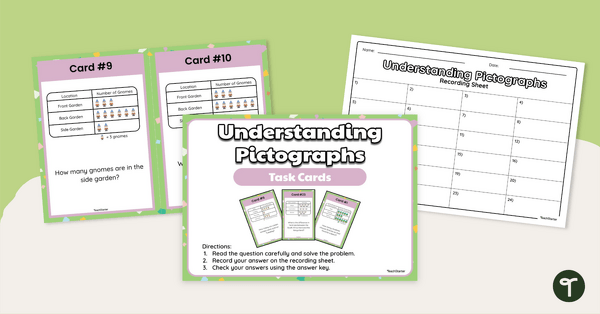
Understanding Pictographs - Task Cards
Use this set of task cards to practice reading and interpreting pictographs and bar graphs.
- Plus Plan
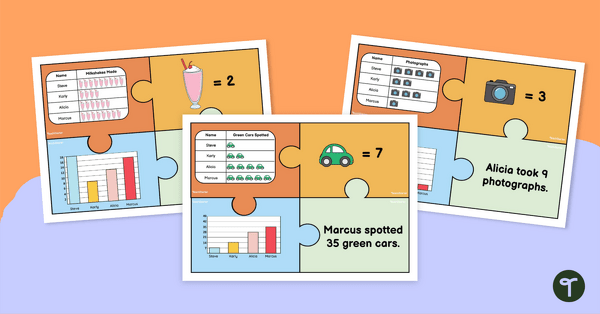
Pictograph Puzzles
Practice reading and interpreting pictographs with these fun puzzles which require students to match pictographs with other data displays with matching data.
- Plus Plan
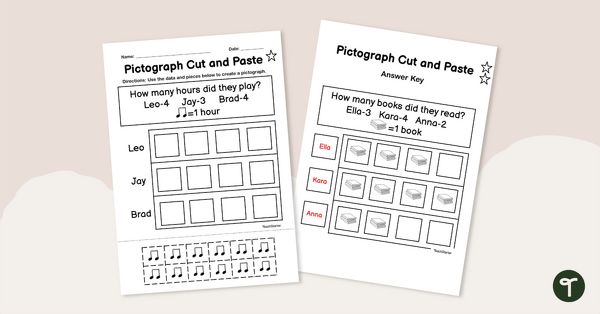
Pictograph Cut and Paste Worksheet
Use this fun cut-and-paste worksheet to build student understanding of pictographs and encourage them to practice their fine motor skills.
- Plus Plan
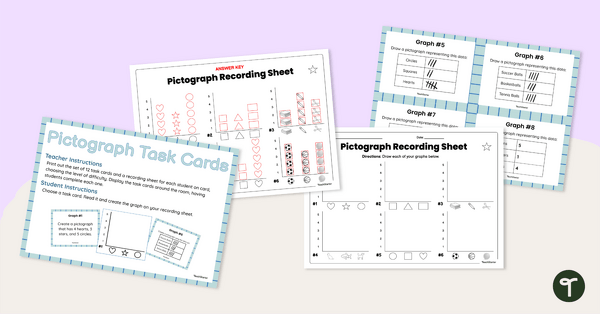
Graphing (Pictographs) Task Cards
Get graphing! Use these levelled pictograph task cards to show students a variety of data collection records, and have them create pictographs to represent that data.
- Plus Plan
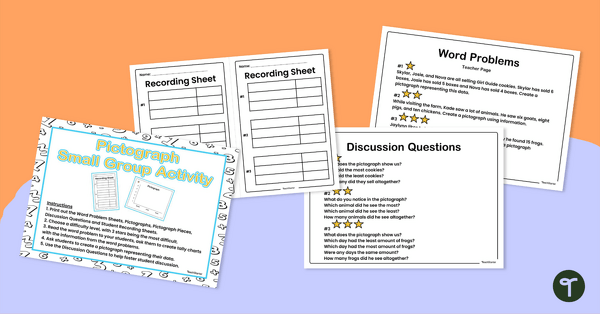
Create a Pictograph – Small Group Activity
Teach students how to create simple pictographs using data from word problems with this small group activity.
- Plus Plan
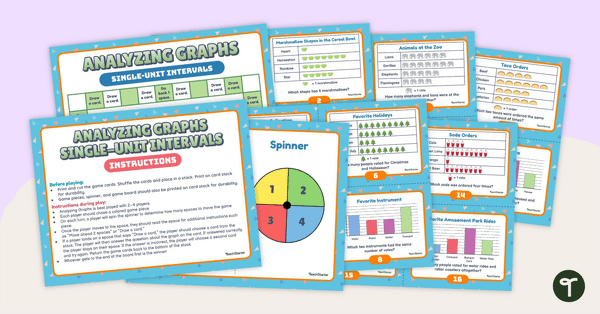
Analyzing Graphs (Single-Unit Intervals) – Board Game
Sharpen student data analysis skills when solving problems with information presented in a single-unit picture graph and bar graph with this board game.
- Plus Plan
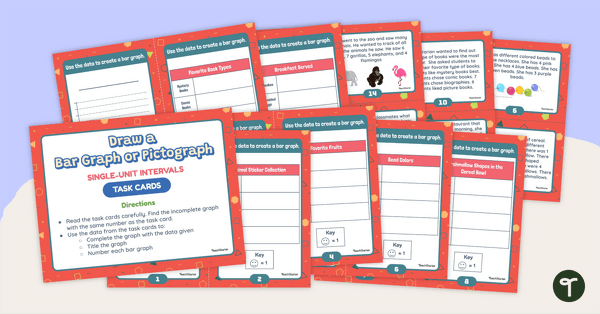
Draw a Bar Graph and Pictograph Task Cards (Single-Unit Intervals)
Practice drawing single-unit bar graphs and pictographs with this set of task cards.
- Plus Plan
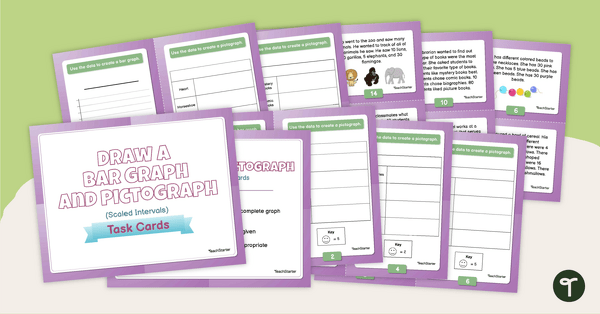
Draw a Bar Graph and Pictograph (Scaled Intervals) – Task Cards
Practice drawing scaled bar graphs and pictographs with this set of task cards.
- Plus Plan
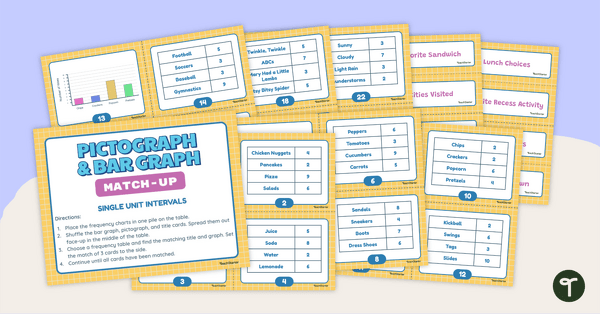
Pictograph and Bar Graph Match-Up (Single-Unit Intervals)
Use data analysis skills to match frequency tables with a corresponding bar graph or pictograph.
- Plus Plan
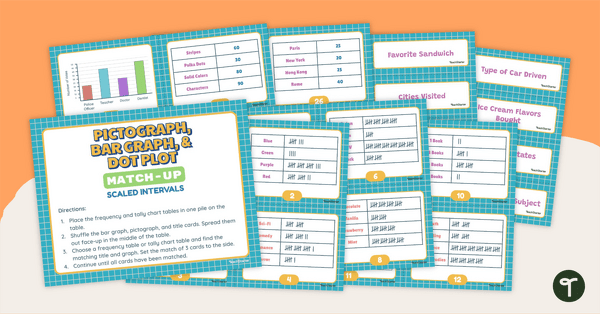
Pictograph, Bar Graph, & Dot Plot Match-Up (Scaled Intervals)
Use data analysis skills to match tally charts and frequency tables with their corresponding bar graph, pictograph, or dot plot.
- Plus Plan
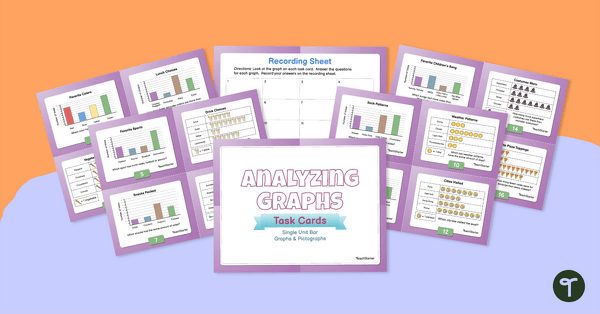
Analyzing Graphs – Single-Unit Bar Graphs & Pictographs – Task Cards
Use data analysis skills to analyze bar graphs and pictographs with this set of task cards.
- Plus Plan
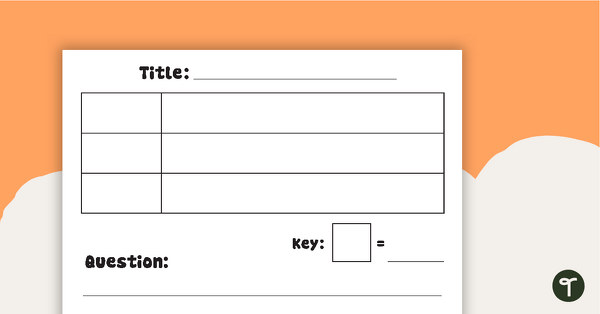
Picture Graph Templates
A set of blank picture graph templates for students to represent data.
- Plus Plan
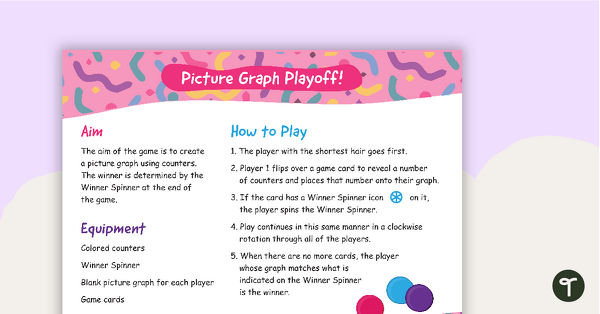
Picture Graph Playoff – Math Game
A fun game for students to practice gathering and representing data in a picture graph.
- Plus Plan
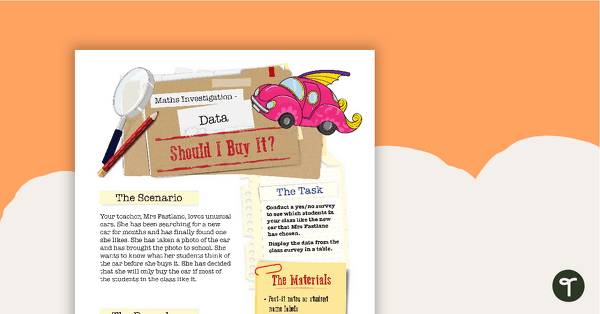
Data Math Investigation - Should I Buy It?
Practice collecting and graphing data in a real-world situation.
- Plus Plan
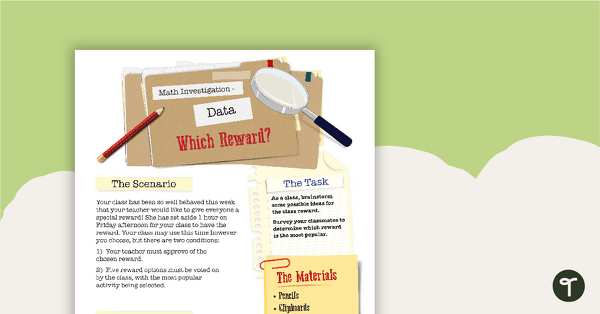
Data Math Investigation - Which Reward?
A mathematics investigation involving data collection and representation, embedded in a real-world context.